Supplementary Material
6. Nonscanning radiometers view the entire hemisphere of radiation, but with a roughly 1000-km field of view. Scanning radiometers view radiance from a single direction and must estimate the hemispheric emission or reflection. Because of this fundamental difference scanner and non-scanning radiometers are each treated as a single group for the anomalies. The Nimbus-7 nonscanner is a thermistor bolometer (1, 2). ERBE/ERBS nonscanner is a hemispheric view active cavity radiometer and is also used for solar constant measurements (3). The ERBE/ERBS scanner is a scanning thermistor bolometer with 40-km nadir field of view (4). ScaRaB is a scanning pyroelectric radiometer with a 60-km nadir field of view (5, 6). CERES is a thermistor bolometer scanning radiometer with a nadir field of view of 10-km on TRMM and 20-km on Terra spacecraft (7-9). All scanner anomaly data are referenced to the ERBE scanner 1985-1989 average. The ERBS nonscanner provides its own reference for the 1985-1989 period. The short gaps in the ERBS nonscanner record were caused by spacecraft battery power problems which caused the instrument to be kept in a stowed position until the battery problems were resolved. All of the scanner radiation data sets exist in only one version. The second version of the nonscanner ERBS data is used. This data set screened any 2.5° latitude/longitude regions with large time sampling noise, primarily at latitudes above about 40°. No calibration changes to the data were made. The version of the Nimbus-7 data published in (2) is used.
Since the scanner data sets are not overlapping (with the exception of CERES on TRMM and Terra missions) both absolute accuracy and instrument stability can affect the anomaly records for the scanners. Estimates from instrument calibration studies are that the absolute accuracies of LW fluxes for ERBE and ScaRaB are 1%, and for SW fluxes are 2% (4-6). The accuracies for the newer CERES instruments are 0.5% and 1% respectively (7-9). These accuracies would predict that anomalies as large as 4 Wm-2 for LW fluxes and 3 Wm-2 for SW fluxes could occur from scanner absolute calibration differences. Therefore, the results in this paper rest more strongly on the long time series of stable overlapping nonscanner records from Nimbus 7 and ERBS than for the nonoverlapped scanner records. It also suggests that overlap of future radiation data will be a key to obtaining climate records capable of examining future decadal variability.
Because the 15-year ERBS satellite record only covers latitudes 60°N to 60°S, understanding decadal variability of global fluxes will require closer examination of the calibration consistency of the much shorter nonoverlapped global scanner records on Nimbus 7, NOAA-9, Meteor, Resurs, and Terra satellites. Fundamental limits in satellite orbital mechanics require that global records be acquired from sun-synchronous orbits (Nimbus 7, NOAA-9, Resurs, Terra) that sample only two times a day, or from orbits like Meteor that take 6 months or longer to sample the complete diurnal cycle of radiation (6). As a result, more accurate methods will also be required to remove systematic global diurnal sampling errors, especially for SW fluxes (7).
8. NOAA satellite data from two narrowband scanning radiometers (NOAA and HIRS) have been used routinely to estimate broadband LW flux. The AVHRR and HIRS radiometers directly measure only a small portion of the broadband infrared spectrum and rely on radiative transfer theory or regressions to derive broadband LW radiative fluxes. In terms of calibration accuracy and sampling of the LW spectrum, the least rigorous of these three measurements is the AVHRR record, followed by the HIRS record. A second subtlety of these records which is not an issue for any of the satellites used in Fig. 1, is that the NOAA afternoon orbiting spacecraft slowly drift several hours in local time sampling over a period of years. There are also shifts in the records between whether a morning or afternoon satellite was used. We compared the broadband LW flux anomaly record in Fig. 1 with the most recent HIRS Pathfinder A data set (10) and the AVHRR PATMOS data set, both of which attempt to correct for differences in instrument calibration as well as diurnal cycle shifts in satellite sampling. The results are shown in Web fig. 1. For decadal variations, the AVHRR LW flux estimate shows a decrease of about 2 Wm-2, the HIRS LW flux an increase of about 1 Wm-2, while the broadband data in Fig. 1 shows an increase of about 3 Wm-2. Correlations between these time series and the broadband LW flux in Fig. 1 are 0.68 for HIRS and 0.09 for AVHRR. Some efforts including the International Satellite Cloud Climatology Project have concluded that the AVHRR window channel record is not sufficiently accurate and stable for decadal climate records (11, 12). The discrepancies between the AVHRR and HIRS record suggest that further work on the accuracy of the HIRS and AVHRR records is needed for climate application at large time and space scales.
9. The ERBS nonscanner Wide Field of View instrument uses two active cavity hemispheric sensors similar to those used for solar constant measurements: a Total channel that measures all radiation (SW and LW) from 0.3 to 100 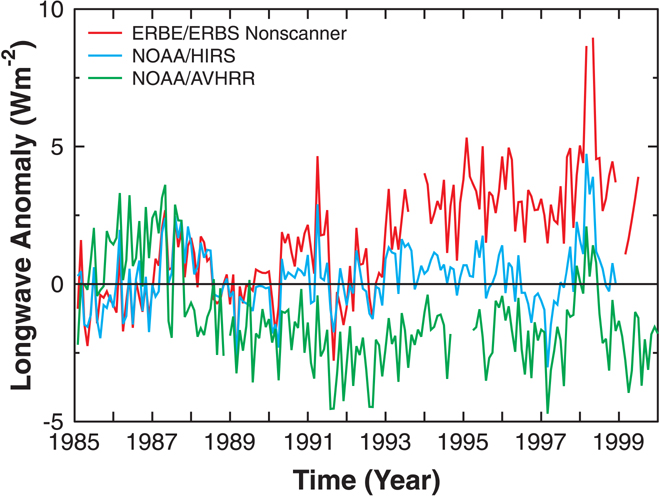 m wavelengths and a SW channel from 0.3 to 3.5
 ![]() m wavelengths. During daytime observations, the LW flux is determined as the Total minus the SW flux. Once every 2 weeks both Total and SW cavities are rotated to view the sun. The solar viewing data verify the stability of the Total channel gain to better than 0.1% over the entire 16-year record, i.e., a shift of Earth viewing flux of less than 0.25 Wm-2. The SW channel has a filter dome that decreases in transmission with solar ultraviolet exposure by about 8% over 15 years as determined from solar constant measurements. This 8% drop in transmission is accounted for in processing the Earth viewing SW flux data, and accuracy of the dome filter correction with time is estimated to be 0.5% or better: approximately 0.5 Wm-2 in the tropical mean SW reflected flux. We checked this correction in three independent ways:
m wavelengths. During daytime observations, the LW flux is determined as the Total minus the SW flux. Once every 2 weeks both Total and SW cavities are rotated to view the sun. The solar viewing data verify the stability of the Total channel gain to better than 0.1% over the entire 16-year record, i.e., a shift of Earth viewing flux of less than 0.25 Wm-2. The SW channel has a filter dome that decreases in transmission with solar ultraviolet exposure by about 8% over 15 years as determined from solar constant measurements. This 8% drop in transmission is accounted for in processing the Earth viewing SW flux data, and accuracy of the dome filter correction with time is estimated to be 0.5% or better: approximately 0.5 Wm-2 in the tropical mean SW reflected flux. We checked this correction in three independent ways:
(i) The decrease in dome transmission is exponential: most of it occurs in the first few years. Two-thirds of the drop in SW transmission occurs in 1985 to 1990, a period when no systematic shift is observed in tropical mean LW or SW, and as seen in Fig. 2, both the ERBS scanner (no SW filter degradation) and the ERBS nonscanner SW and LW flux anomalies agree to within 0.5 W/m2. We conclude that any errors in correction of the SW dome transmission are poorly correlated with the decadal changes shown in Fig. 2.
(ii) Night-time LW fluxes are derived using the Total channel, while daytime SW fluxes are derived using the Total minus the SW channel. As a result, errors in transmission of the SW channel will affect only daytime LW fluxes, and any resulting time averaged SW and LW flux errors would be in phase for monthly mean data, of the same magnitude, but opposite in sign . The large seasonal cycle of SW and Net flux anomalies in 1994-1997 (Fig. 3) is not seen in the LW flux anomalies, and therefore cannot be explained by dome transmission errors.
(iii) We separately determined night-time and daytime LW flux anomalies from 1985-1999. They are consistent to about 1 Wm-2, with daytime anomalies larger. But this day/night difference would be consistent with at most a diurnally averaged 0.5 Wm-2bias in SW fluxes, and would explain only 15% of the observed decadal changes. The small day/night difference in LW flux anomalies could also be caused by changes in the diurnal cycles of cloudiness. We conclude that these three independent tests confirm that the use of biweekly solar constant measurements is accurately determining the dome transmission loss for the ERBS nonscanner over this time period. Lastly, the time series of the ERBS nonscanner offset or zero level of the Total channel and SW channel were compared to the tropical mean SW and LW flux anomalies. The offsets showed no correlation with the anomalies presented in Fig. 1 or Fig 2. Overall, we found no calibration changes that could account for more than 0.5 Wm-2of the decadal variability of either SW or LW radiative fluxes in 1985 through 1999.
19. The correlation between the nonscanner LW observed monthly tropical anomalies (January 1985 through August 1998) and the model anomalies was determined. Correlation coefficients were 0.6 for the HadAM3, 0.3 for the NCEP Reanalysis, 0.15 for the GFDL-EP, and 0.1 for the GFDL Climate model and the NCAR CCM3 model. Accounting for the degrees of freedom in the anomaly time series, only the HadAM3 and NCEP Reanalysis correlations are significant at the 95% confidence level. For all but the GFDL-EP, the standard deviation of the model LW flux anomalies ranged from 0.9 to 1.2 Wm-2versus 2.1 for the observations: about a factor of 2 difference. The GFDL-EP had a standard deviation of 1.7. None of the models show significant (95% confidence) correlation with the tropical SW anomalies (range of values are -0.1 to +0.15), while only the NCEP and HadAM3 correlations are significant for Net flux anomalies with a correlation of 0.3. It is recognized that obtaining correct SW fluxes in climate models is more difficult than LW fluxes, especially for boundary layer cloud, and these decadal change results confirm that conclusion. The HadAM3 and NCAR models were run for five different climate realizations with slightly different initial conditions; all other models used a single model realization.
References
- H. L. Kyle et al., J. Atmos. Ocean. Technol. 12, 1137 (1995).
- T. D. Bess et al., Bull. Am. Meteorol. Soc. 70, 480 (1989).
- R. B. Lee III, R. S. Wilson, SPIE Proc. Ser. 3439, 377 (1998).
- B. R. Barkstrom et al., Bull. Am. Meteorol. Soc. 70, 1254 (1989).
- R. M. Kandel et al., Bull. Am. Meteorol. Soc. 79, 765 (1998).
- J.-P. Duvel et al., Bull. Am. Meteorol. Soc. 82, 1397 (2001).
- B. A. Wielicki et al., Bull. Am. Meteorol. Soc. 77, 853 (1996).
- CERES ES4 TRMM Data Quality Summary. (http://eosweb.larc.nasa.gov/PRODOCS/ceres/ES4/Quality_Summaries/CER_ES4_TRMM-PFM_Edition1.html)
- CERES ES4 Terra Data Quality Summary. (http://eosweb.larc.nasa.gov/PRODOCS/ceres/ES4/Quality_Summaries/CER_ES4_Terra_Edition1.html)
- A. Mehta, J. Susskind, J. Geophys. Res. 104, 12193 (1999).
- W. B. Rossow, R. A. Schiffer, Bull. Am. Meteorol. Soc. 80, 2261 (1999).
- C. L. Brest et al., J. Atmos. Ocean. Technol. 14, 1091 (1997).
Supplemental Figure 1. Tropical mean (20°S to 20°N) longwave flux anomalies for the broadband ERBE ERBS nonscanner compared to the narrowband estimates from NOAA HIRS (High Resolution Infrared Sounder) and AVHRR (Advanced Very High Resolution Radiometer).
Volume 295,
Number 5556,
Issue of 1 Feb 2002,
p. 841.