Junye Chen, Barbara E. Carlson, and Anthony D. Del Genio
|
|
Evidence for Strengthening of the Tropical General Circulation in the 1990s Junye Chen, Barbara E. Carlson, and Anthony D. Del Genio |
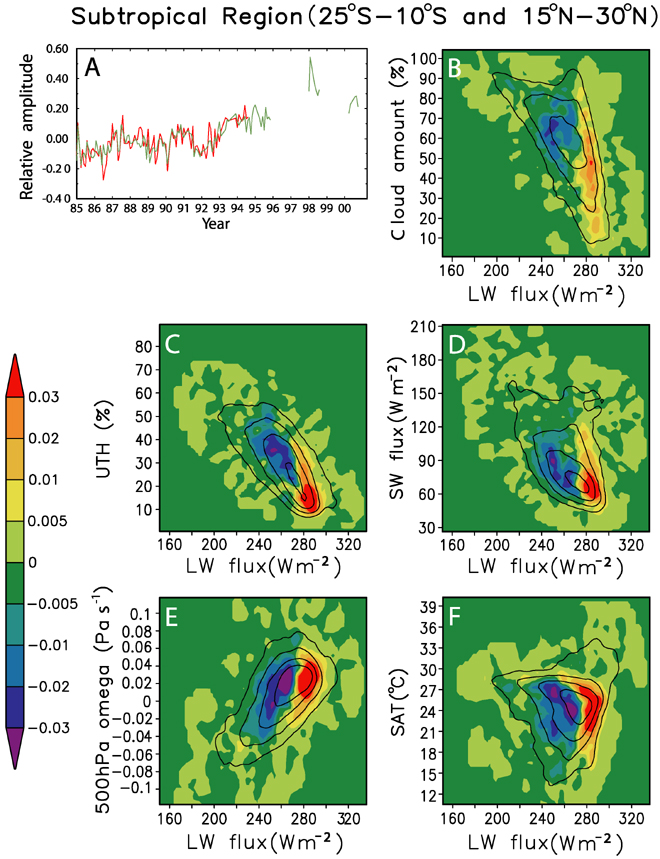
Supplemental Figure 2. The first mode of the combined JFD EOF for the subtropical region data. This mode accounts for 9.3% of the total variance. (A) The PC time series (red line) and the 30°S-30°N mean LW flux anomalies (green line). The CC between the PC and the LW anomalies is 0.79, and the PC trend is confident at the 99% level (33). The JFD patterns: (B) cloud amount - LW flux; (C) UTH - LW flux; (D) SW flux - LW flux; (E) 500 hPa Omega - LW flux; (F) SAT - LW flux.
Supplemental Figure 3. The second mode of the combined JFD EOF for the equatorial region data. This mode accounts for 5.5% of the total variance. (A) The PC time series (red line) and the 30°S-30°N mean LW flux anomalies (green line). The CC between the PC and the LW anomalies is 0.64, and the PC trend is confident at the 89% level. The JFD patterns: (B) cloud amount - LW flux; (C) UTH - LW flux; (D) SW flux - LW flux; (E) 500 hPa Omega - LW flux; (F) SAT - LW flux.
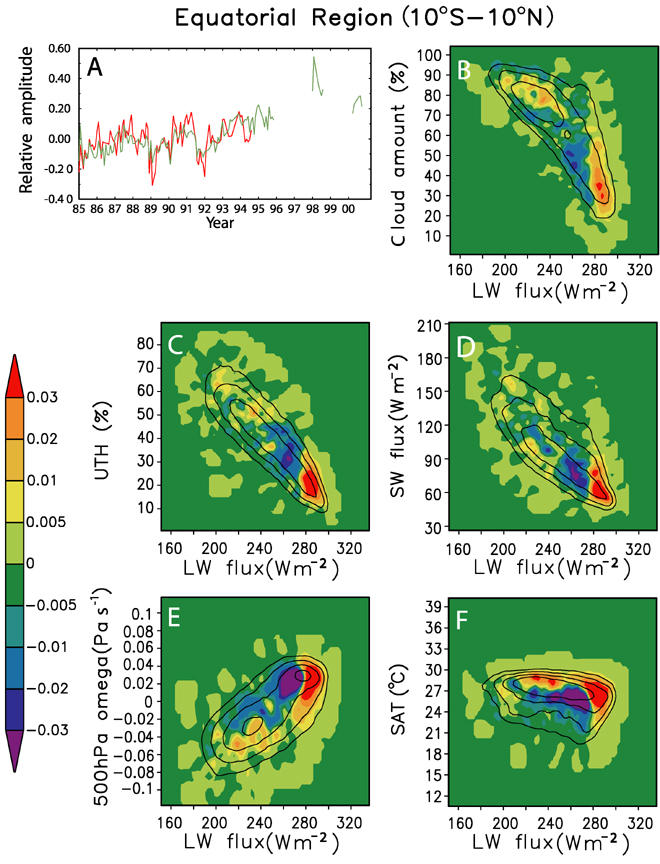
Supplemental note: The impressions of SAT-LW changes in the subtropical and equatorial regions (Supplemental Figs. 2F and Fig. 3F) are different for two reasons: (1) The much larger LW changes in the subtropics dominate the JFD anomaly pattern there. (2) Part of the subtropical SAT increase occurs at extreme high SAT values not present in the equatorial region. Nonetheless, mean SAT increases by similar amounts, 0.083(C, in the subtropical and equatorial regions.
Volume 295,
Number 5556,
Issue of 1 Feb 2002,
p. 838.