Update of surface fluxes (following Liu et al. 2017, Mayer et al. 2017)
1. TOA radiation flux
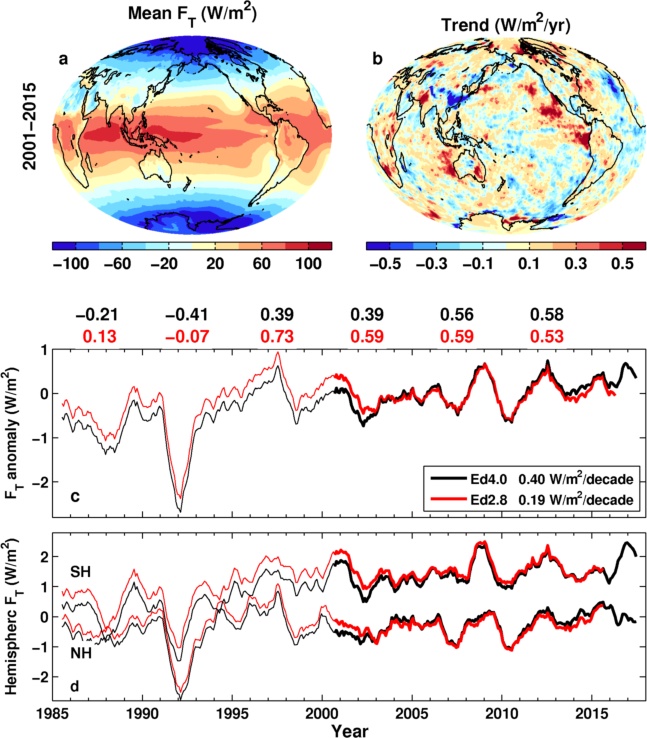
Fig. 1: (a) Multiannual (2001-2015) mean net downward radiation flux at TOA (FT), (b) FT trend over 2001-2015, (c) FT anomaly time series from old and updated TOA fluxes, the reference period is from 2001-2015, and (d) area mean FT in southern and northern hemispheres. All lines are 12 month running mean.
- Data from CERES Ed4.0 and Ed2.8
- Note the obvious trend of Ed4.0
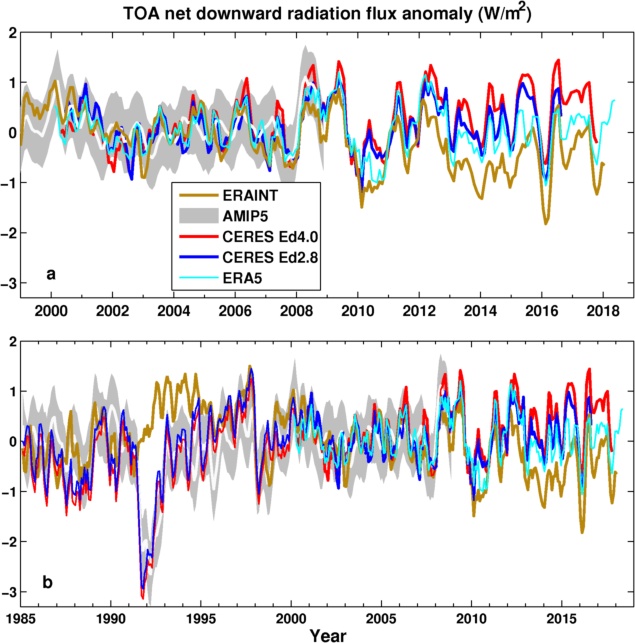
Fig. S1: (a) Net TOA radiation anomaly (relative to 2001-2005) time series from ERAINT, AMIP5 ensemble mean, CERES Ed4.0 and Ed2.8, and ERA5. (b) Together with the reconstructed time series prior to CERES
T anomaly time series from old and updated TOA fluxes, the reference period is from 2001-2015, and (d) area mean FT in southern and northern hemispheres. All lines are 12 month running mean.
- Data from CERES Ed4.0 and Ed2.8
- Note the obvious trend of Ed4.0
- Three month running mean is applied
- ERA5 trend is more upperward than the ERAINT trend.
- Correlation between CERES and ERAINT is about 0.8, between CERES and ERA5 about 0.9, and between CERES and AMIP5 mean about 0.4
- The first twelve month (March 200 - February 2001) mean difference between CERES Ed4.0 and CERES Ed2.8 is about 0.31 Wm-2.
- From (a), it can be seen that the ERA5 is closer to CERES Ed4.0, and ERAINT is closer to CERES Ed2.8 at the begining of CERES data.
2. Surafce flux
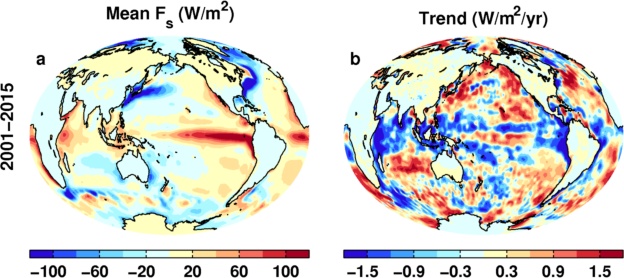
Fig. 2: (a) Multiannual (2001-2015) mean net downward surface flux (FS), and (b) FS zonal mean.
- Note the small peak around 12oN, which is not seen in earlier version, and will cause lage cross equatorial transport.
Fig. 3: to be here soon
3. Infered transport
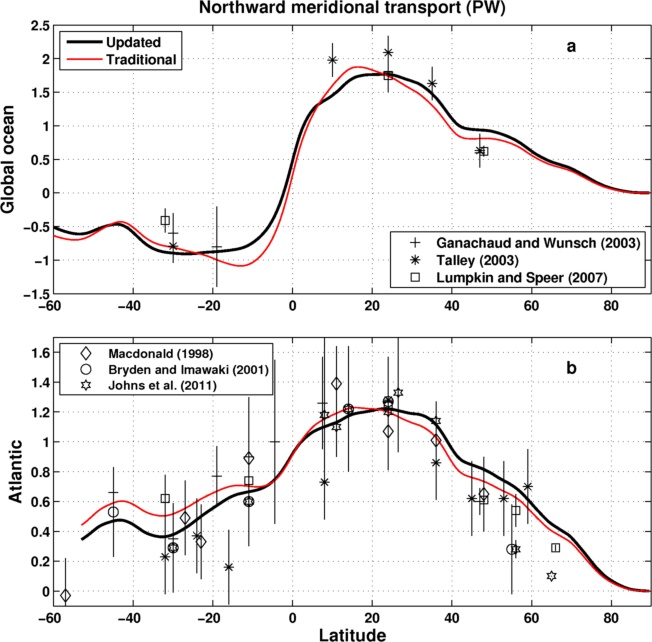
Fig. 4: Figure 4. Multiannual mean (2006-2013) northward total meridional ocean heat transports (unit is PW) for (a) the global ocean and (b) the Atlantic derived from the reconstruction (lines) and estimated from observations (symbols, error bars show one standard deviation). Reconstructions are inferred from ocean heating estimated from Roemmich et al. [2015] combined with the ocean surface fluxes using updated and tradition methods, respectively.
- Significant increase of crossing equatorial transport.
- Much closer to transport at 26oN.
- More consistent with observations in southern hemisphere
- Slightly higher in northern hemisphere, maybe related to redistribution of excess land surface fluxes as described by Liu et al. (2017).
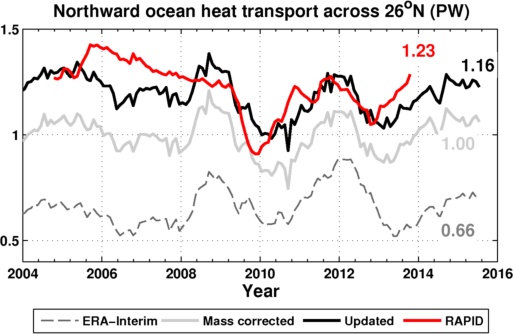
Fig. 5: Northward meridional ocean heat transports (unit is PW) at 26oN of North Atlantic from RAPID observations (red) and updated surface fluxes (black), together with the transports inferred from ERA-Interim model surface fluxes and the one with mass corrected atmospheric energy divergences. The multiannual mean (2004-2013) transports are also displayed in the plot.
- The FT is achored to 0.59 Wm-2 over 2006-2013
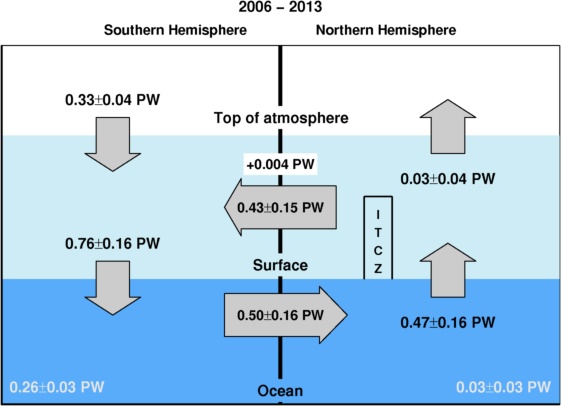
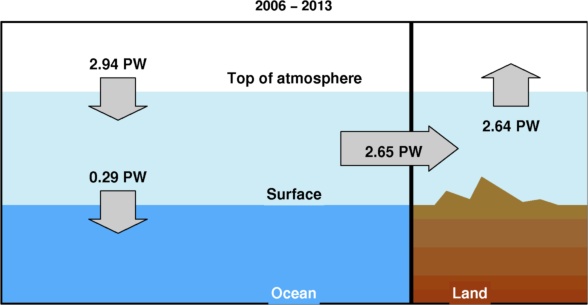
Fig. 6: Updated observations of energy flows in the climate system in petawatts (PW) over 2006-2013 and the location of the Intertropical Convergence Zone (ITCZ). TOA radiation flux is from CERES EBAF 4.0 anchored to 0.59 Wm-2 over 2006-2013. Ocean heat storage is based on observations [Roemmich et al., 2015].
- Note the large cross equatorial transport