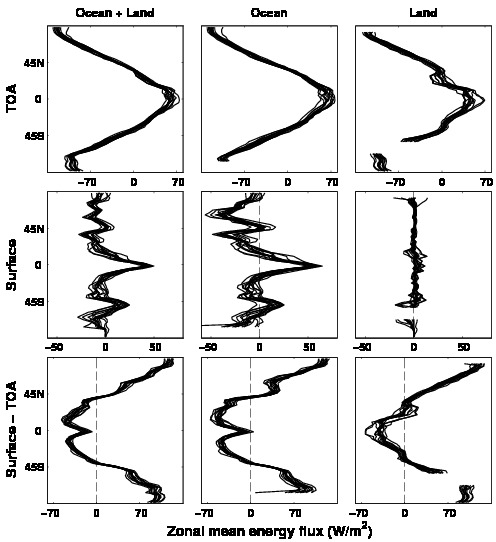
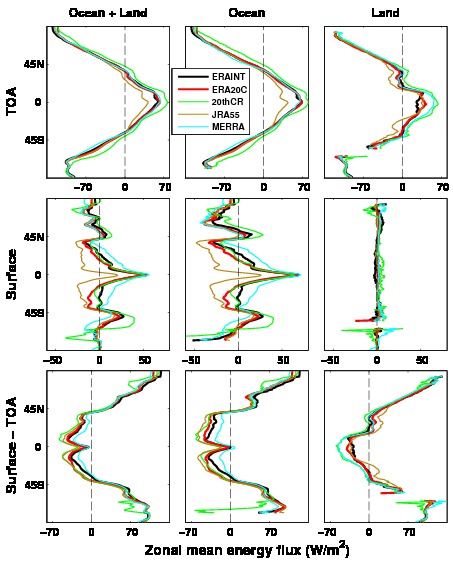
Fig. 1: Multiannual (2001-2008) zonal mean fluxes from AMIP5 (left) and reanalysis (right).
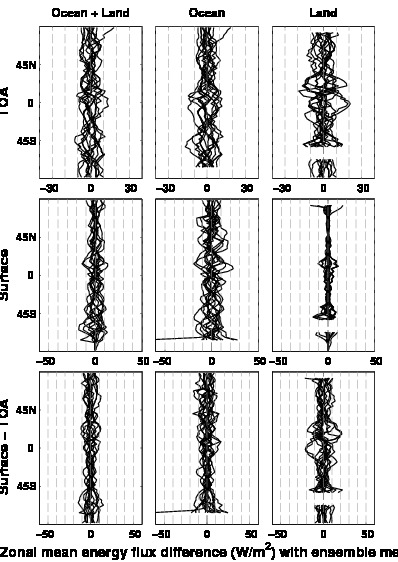
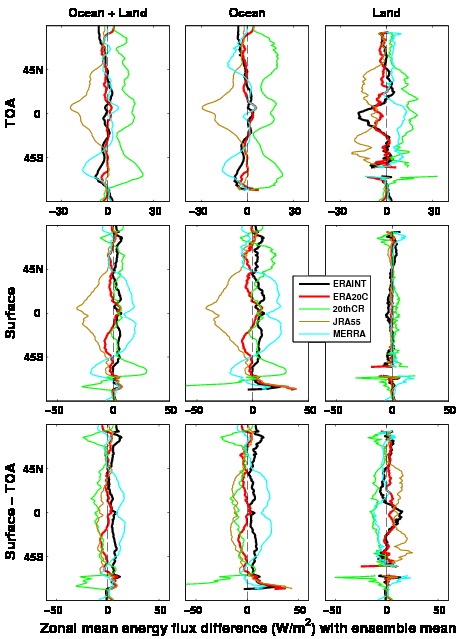
Fig. 2: Multiannual zonal mean differences with ensemble mean.
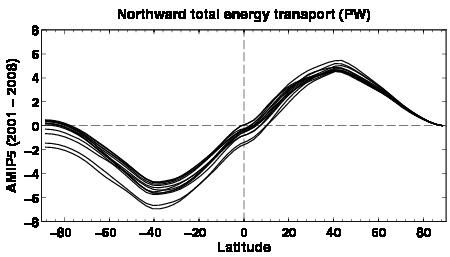
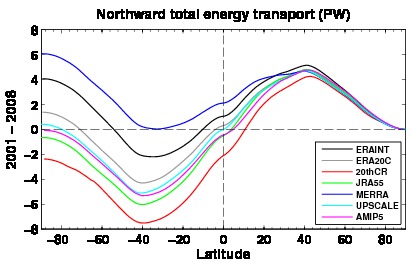
Fig. 3: Northward total energy meridional energy transport (in PW) calculated from the multiannual mean (2001-2008) divergences.
- Integration starts from the north pole.
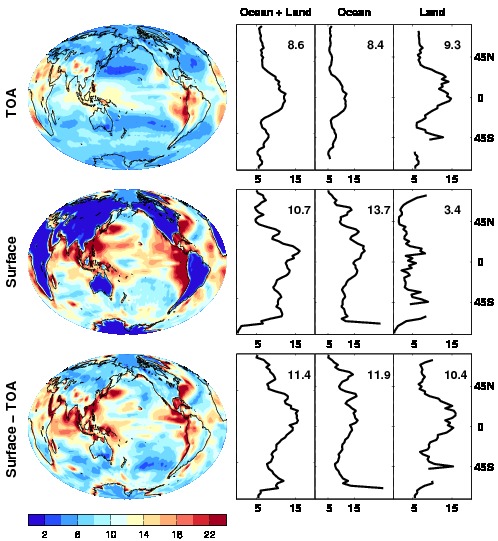
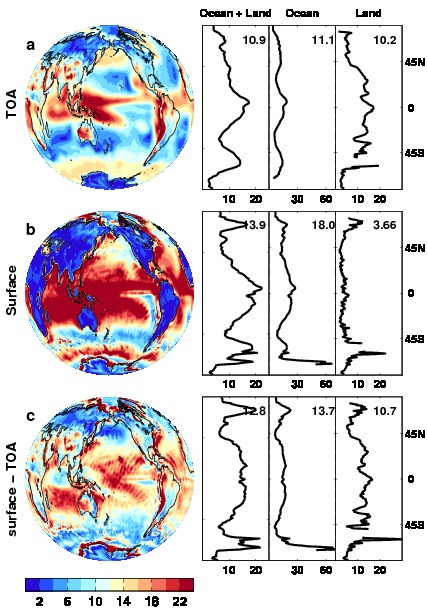
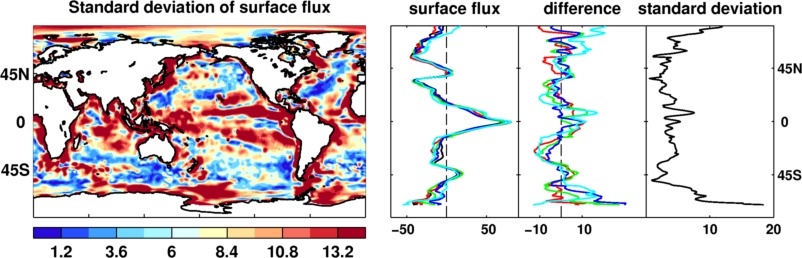
Fig. 4: Standard deviation of the multiannual means from AMIP5 (left) and reanalysis (right).
- The spread from reanalysis is larger than that from AMIP5 models.
- This is due to assimilation which caused the inconsistence in atmospheric mass.
- The fluxes from reanalysis is 12 hrs forecasts, need "increment" correcions.
(Mayer and Haiberger, 2012; Liu et al., 2015)
2. After constrain
- Use reconstructed TOA flux (Allan et al., 2014)
- Ise model divergence defined above.
- The divergence from each model is adjusted so that the mean surface flux over land is zero.
- Then the global mean divergence is set to zero by remove a constant from mean divergence over the ocean.
- The following plots show how good the simple constrain is to reduce the spread.
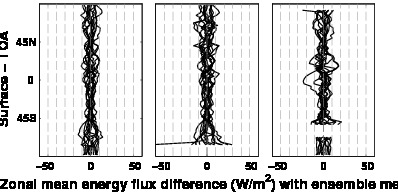
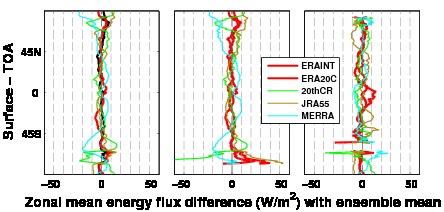
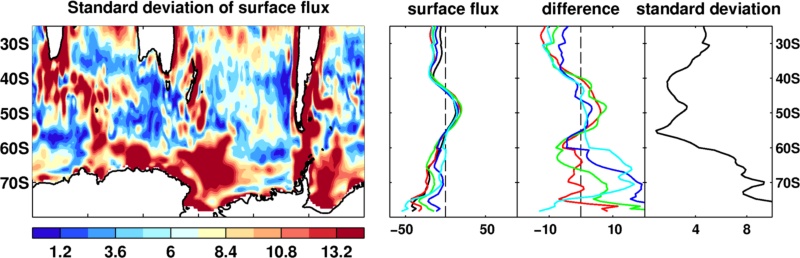
Fig. 5: As Fig. 2. Multiannual zonal mean differences with ensemble mean.
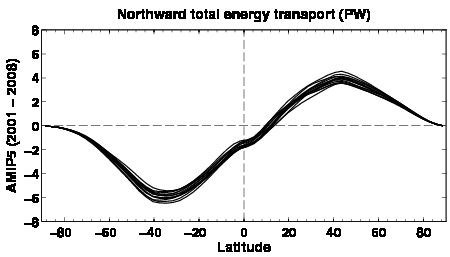
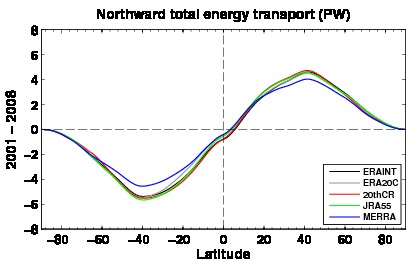
Fig. 6: As Fig. 3. Northward total energy meridional energy transport (in PW) calculated from the multiannual mean (2001-2008) divergences.
- It seems the cross equator transports from AMIP5 data are larger than expected, so it is over adjusted.
- Maybe the 15o latitude band should be used as in Liu et al. (2015).
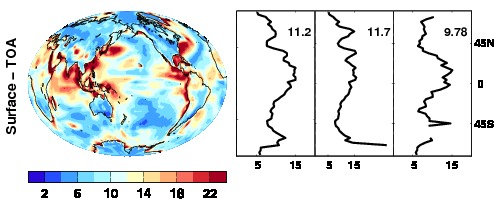
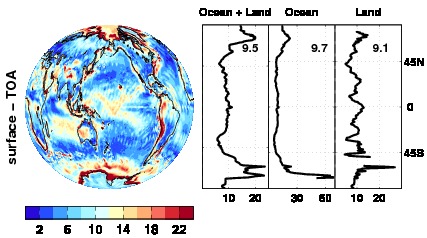
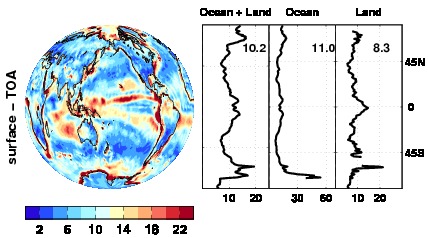
Fig. 7: As Fig. 4. Standard deviation of the multiannual means from AMIP5 (left) and reanalysis (right).
- The spread in reanalysis is greatly reduced.
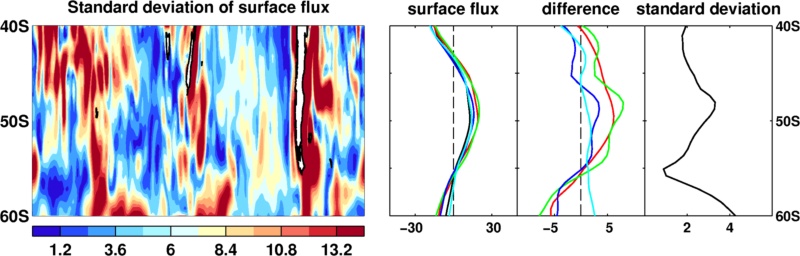
3. Compare with data from Michael Mayer
- To see how good the simple constrain is, the mass corrected and increment corrected divergences from Michael Mayer are used to compare with those from the simple method.
(a)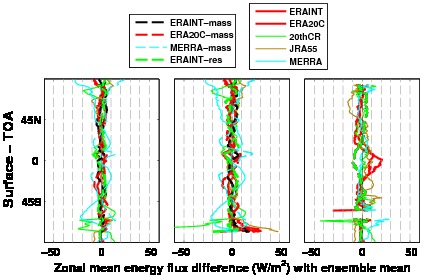
(b)
(c)
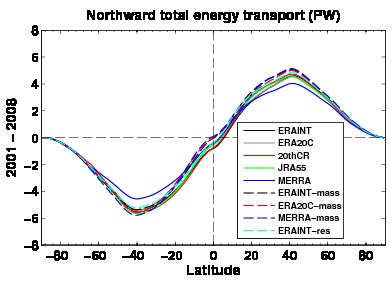
Fig. 8: The multiannual mean net surface flux difference between ERAINT and other data sets.
- It is hard to see eah lines in (a), but the spread is comparable and the difference is ~10W/m2 over the global ocean.
- Compared with the reanalysis spatial spread in Fig. 7, the spread in (b) is larger over oceans near equator. This is from the mass/increment corrected data.
- The transport is comparable as well.>/li>
Wednesday 23/09/2015
Uncertainties of net surface fluxes from atmospheric reanalysis data sets
Contents
1. Introduction
- Surface fluxes are important for the understanding of the Earth's energy budget.
- They vary a lot from different atmospheric reanalysis.
- Uncertainty is estimated from different data sets.
- Data sets:
Atmospheric reanalysis: ERAINT, ERA20C, 20thCR, JRA55 and MERRA.
Climate model simulations: UPSCALE (5 ensemble members), AMIP5 (16 ensemble members)
Atmospheric reanalysis: ERAINT, ERA20C, 20thCR, JRA55 and MERRA.
Climate model simulations: UPSCALE (5 ensemble members), AMIP5 (16 ensemble members)
2. Uncertainty from raw data
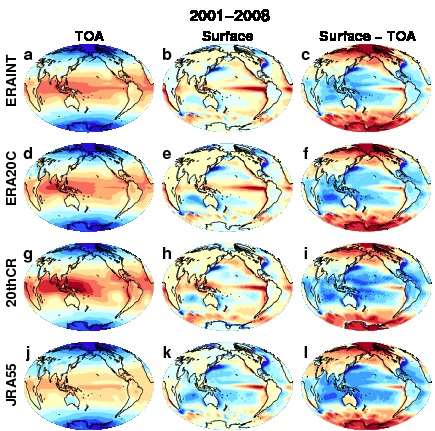
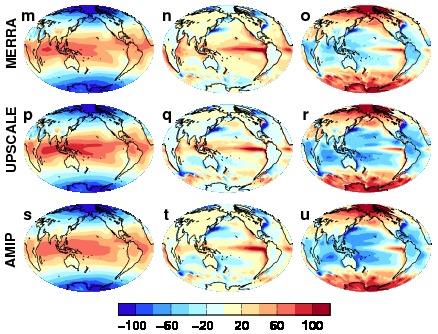
Fig. 1: Multiannual (2001-2008) mean net downward energy flux from ERAINT, ERA20C, 20thCR, JRA55, MERRA, UPSCALE and AMIP5 data sets. The TOA flux is on the left column, the surface flux is in the middle column and the difference is on the right column.
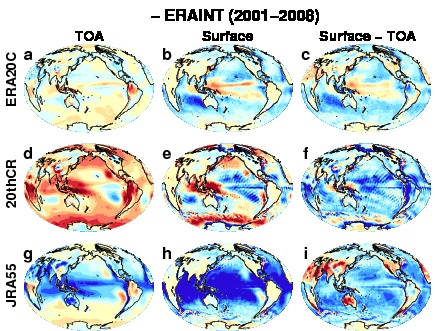
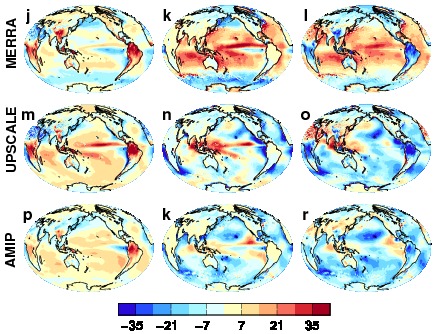
Fig. 2: The multiannual mean net surface flux difference between ERAINT and other data sets.
Fig. 3: Standard deviation of the multiannual means from 5 reanalysis data sets.
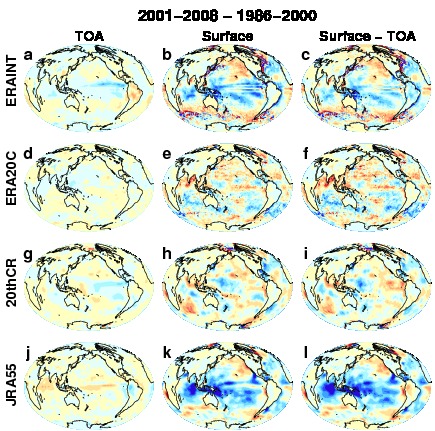
Fig. 4: Differences between two periods (2001-2008 minus 1986-2000).
Fig. 5: Multiannual mean (2001-2008) northward total meridional energy transport (in PW) calculated from the difference between net fluxes at TOA and surface.
- Integration starts from the north pole.
Fig. 6: Zonal mean fluxes over 2001-2008 from reanalysis.
Fig. 7: Zonal mean fluxes difference with ERAINT.
3. Uncertainty from adjusted divergences
- Assume mean surface flux over land is zero, so mean divergence = - mean TOA flux.
- Assume mean global divergence zero.
- Remove mean flux from divegence over ocean.
- Recalculate surface flux using TOA flux and adjusted divergence.
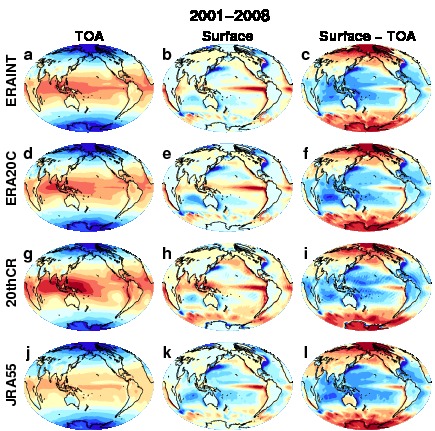
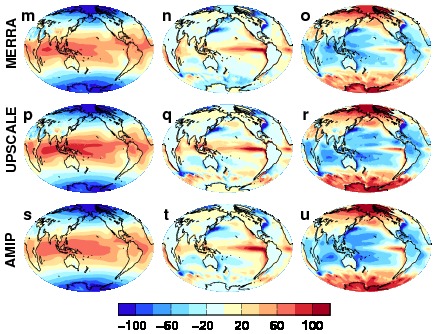
Fig. 8: As Fig. 1, but both surafec flux and divergence are adjusted.
- Fig. 1 and Fig. 6 are similar, can't see much difference due to small adustment.
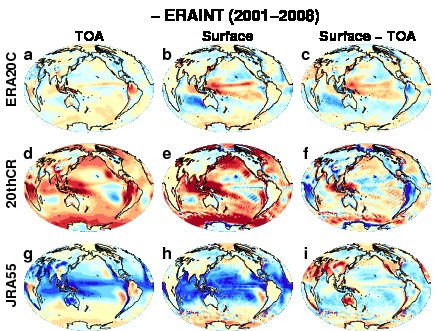
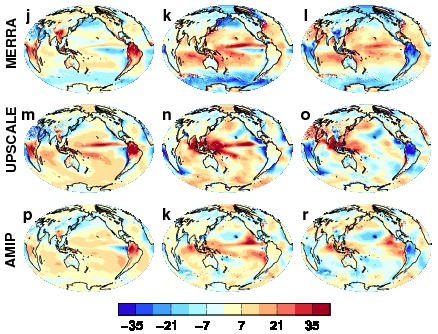
Fig. 9: As Fig. 2, but use adjusted data.
- TOA flux is the same as in Fig. 2.
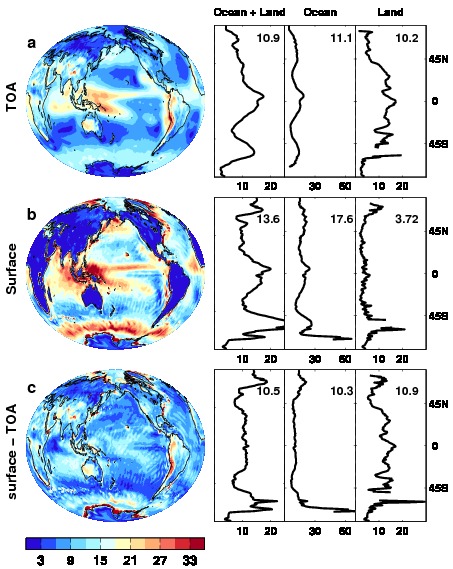
Fig. 10: Standard deviation of the multiannual (2001-2008) means from 5 reanalysis data sets.
- As Fig. 3, but divergences are adjusted over both land and oceans.
- Fig. 10a is the same as Fig. 3a.
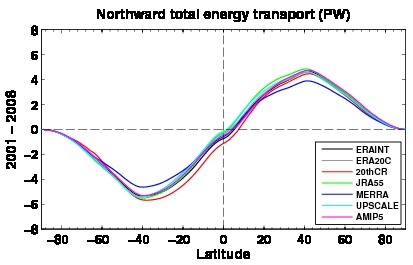
Fig. 11: As Fig. 5.
- Transport converges after divergence adjustment.
- All data sets show hemisphere asymmetry.
4. Uncertainty using reconstructed TOA flux and adjusted divergences
- As section 3, but the TOA flux is from reconstructions (Allan et al 2014)
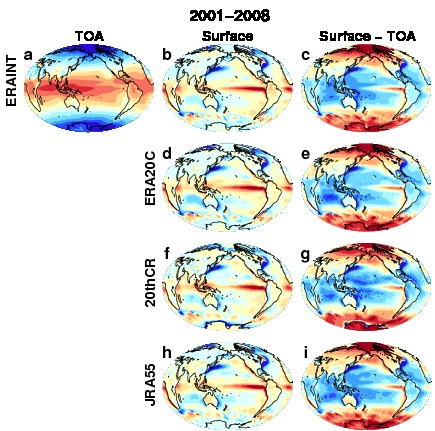
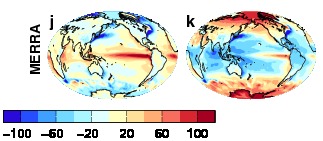
Fig. 12: As Fig. 1, but using reconstructed TOA flux and adjusted divergences.
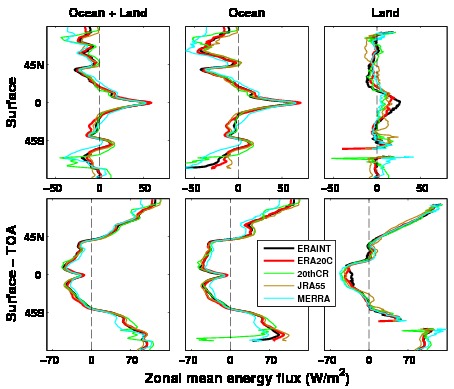
Fig. 13: Zonal mean fluxes over 2001-2008 after adjustment.
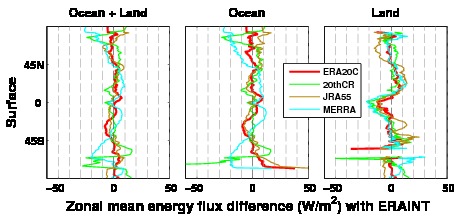
Fig. 14: Zonal mean fluxes difference with ERAINT over 2001-2008 after adjustment.
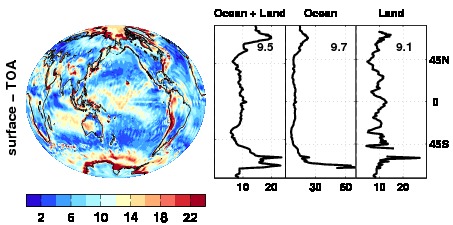
Fig. 15: Standard deviation of the multiannual (2001-2008) means from 5 reanalysis data sets.
- Note this one is in different scale from Fig. 10.
- Since TOA fluxes are same in this case, this is also the STD of the surface fluxes.
Fig. 16: Transports.
- The Divergence over land is adjusted to match the TOA flux from reconstruction.
- Global mean divergence = 0.
- The peaks from MERRA are smaller than others. This is different from the plot in the paper.(maybe mass correction over corrected it)
5. Comparisons
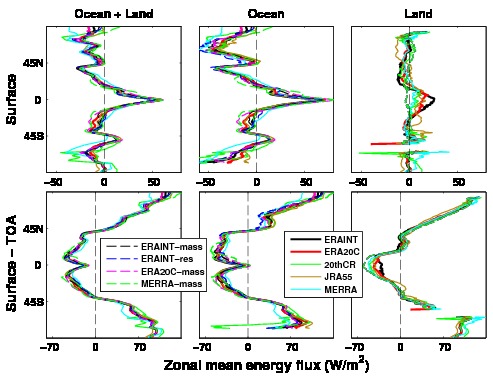
Fig. 17: Zonal mean fluxes over 2001-2008 for all data sets.
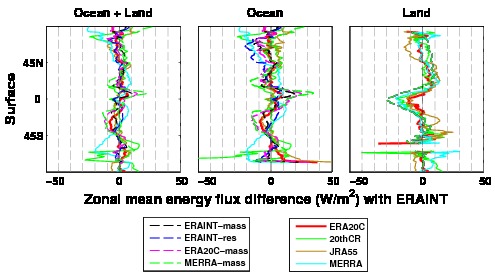
Fig. 18: Zonal mean fluxes difference with ERAINT over 2001-2008 for all data sets.
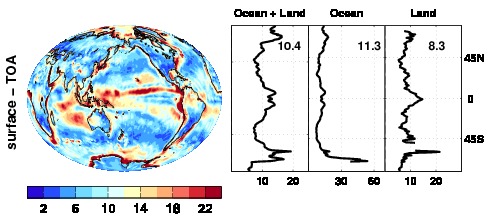
Fig. 19: Standard deviation of the multiannual (2001-2008) means from 5 reanalysis and 4 other data sets.
- Other data sets: 3 mass corrected and 1 increment corrected data sets.
- The large value may be from different divergence adjustment. (15o latitude band and global mean). If same algorithm is used, the large values may be reduced.
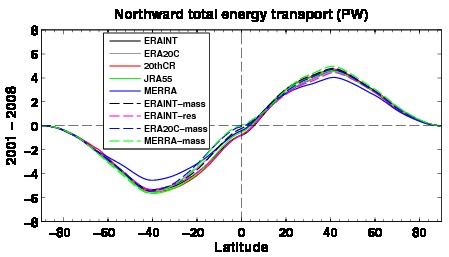
Fig. 20: Transports from all data sets.
6. Discussion
- The standard deviation (STD) of net surface fluxes over oceans is large (18.0 W/m2 over global ocean) and it is mainly caused by the TOA flux differences. (see Figs. 3b and 10c (or 15)
- After using reconstructed TOA flux and divergence adjust, the STD is greatly reduced (10.3 W/m2over global ocean).
- The northward total energy meridional transports are widely spreaded due to unrealistic global mean divergences. (not zero) (see Fig. 5)
- After the adjustment, the transports converge and the spread is reduced greatly. They are consistent in the hemisphere transport asymmetry. The values are between 0 ~ 1PW. (see Fig. 11)
- The multiannual mean surface fluxes differ a lot in spatial structures (see Fig. 2), even after divergence adjustment (see last column of Fig. 9).
- The surface flux differences between two period (Fig. 4) show large differences spatially (see Fig. 4).
- For proper treatment, mass corrected divergences (or increment corrected forecasted fluxes) should be used.
7. References
- Allan, R. P., Liu, C., Loeb, N. G., Palmer, M. D., Roberts, M., Smith, D. and Vidale, P.-L. (2014) Changes in global net radiative imbalance 1985-2012. Geophysical Research Letters, 41 (15). pp. 5588-5597. ISSN 0094-8276 doi: 10.1002/2014GL060962.
END
Extra AMIP5 plots (15 members)
Raw data
Fig. S1: Zonal mean divergences DIV from 15 AMIP5 models (2001-2008).
- All data are interpolated to 3ox3o grid.
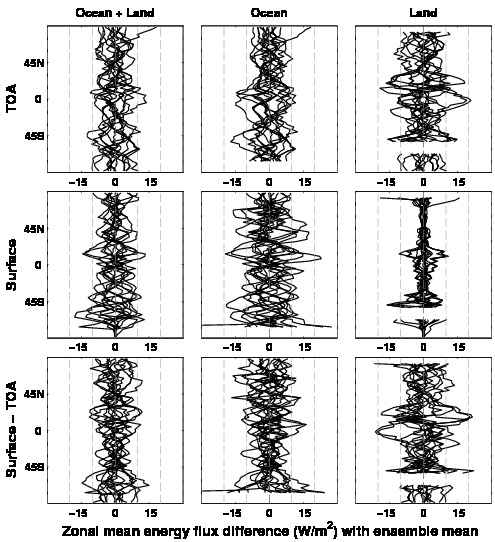
Fig. S2: Zonal mean DIV differences with ensemble means.
Fig. S3: Northward meridional transport.
- Hemisphere asymmetry can be seen across the Equator.
- Consistent with others in peak values and positions.
Fig. S4: Standard deviation of multiannual mean fluxes (2001-2008).
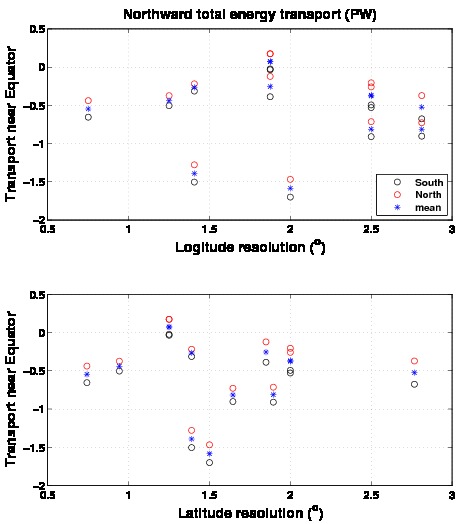
Fig. S5: Relations between Transport near the Equator and the model resolution.
After divergence adjust
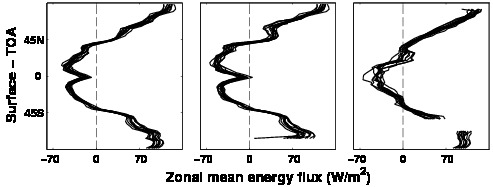
Fig. S6: As the bottom panel of Fig. S1.
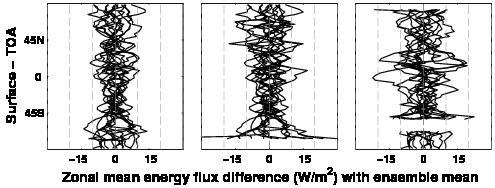
Fig. S7: As Fig. S2.
- Compared with Fig, S2, the difference is reduced over the ocean surface.
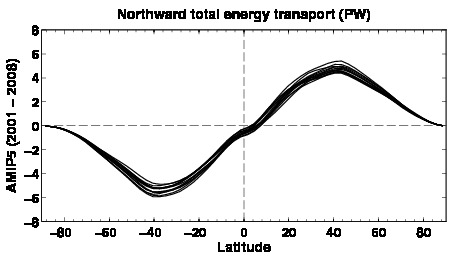
Fig. S8: As Fig. S3.
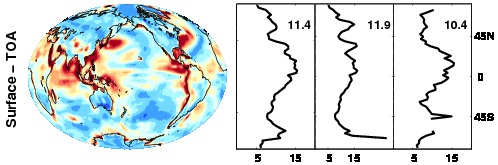
Fig. S9: STD of multiannual mean DIVs (2001-2008).
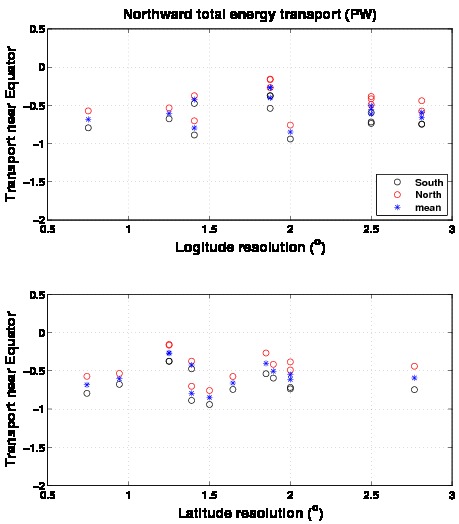
Fig. S10: As Fig. S5.
- Assume mean surface flux over land is zero, so mean divergence = - mean TOA flux.
- Assume mean global divergence zero.
- Remove mean flux from divegence over ocean.
- Recalculate surface flux using TOA flux and adjusted divergence.
- Fig. 1 and Fig. 6 are similar, can't see much difference due to small adustment.
- TOA flux is the same as in Fig. 2.
- As Fig. 3, but divergences are adjusted over both land and oceans.
- Fig. 10a is the same as Fig. 3a.
- Transport converges after divergence adjustment.
- All data sets show hemisphere asymmetry.
- As section 3, but the TOA flux is from reconstructions (Allan et al 2014)
- Note this one is in different scale from Fig. 10.
- Since TOA fluxes are same in this case, this is also the STD of the surface fluxes.
- The Divergence over land is adjusted to match the TOA flux from reconstruction.
- Global mean divergence = 0.
- The peaks from MERRA are smaller than others. This is different from the plot in the paper.(maybe mass correction over corrected it)
- Other data sets: 3 mass corrected and 1 increment corrected data sets.
- The large value may be from different divergence adjustment. (15o latitude band and global mean). If same algorithm is used, the large values may be reduced.
- The standard deviation (STD) of net surface fluxes over oceans is large (18.0 W/m2 over global ocean) and it is mainly caused by the TOA flux differences. (see Figs. 3b and 10c (or 15)
- After using reconstructed TOA flux and divergence adjust, the STD is greatly reduced (10.3 W/m2over global ocean).
- The northward total energy meridional transports are widely spreaded due to unrealistic global mean divergences. (not zero) (see Fig. 5)
- After the adjustment, the transports converge and the spread is reduced greatly. They are consistent in the hemisphere transport asymmetry. The values are between 0 ~ 1PW. (see Fig. 11)
- The multiannual mean surface fluxes differ a lot in spatial structures (see Fig. 2), even after divergence adjustment (see last column of Fig. 9).
- The surface flux differences between two period (Fig. 4) show large differences spatially (see Fig. 4).
- For proper treatment, mass corrected divergences (or increment corrected forecasted fluxes) should be used.
- Allan, R. P., Liu, C., Loeb, N. G., Palmer, M. D., Roberts, M., Smith, D. and Vidale, P.-L. (2014) Changes in global net radiative imbalance 1985-2012. Geophysical Research Letters, 41 (15). pp. 5588-5597. ISSN 0094-8276 doi: 10.1002/2014GL060962.
Raw data
Fig. S8: As Fig. S3.
Fig. S9: STD of multiannual mean DIVs (2001-2008).