Friday 04/09/2015
Objects
1) The net downward surface flux trend (1988-2008) over central Eastern Pacific shows disaggrement between data sets from ERA-Interim atmospheric reanalysis and atmospheric model simulations (Liu et al. 2015, JGR).
2) This area is very important for the understanding of recent "hiatus" (Kosaka and Xie, 2013; Trenberth and Fasullo, 2013; Meehl et al., 2014].
3) Latent heat (LH) change dominates the net surface flux change over the oceans.
4) Investigation using model simulations is complicated, a simple method is used here. LH (see Singh et al 2005) depends on 4 variables: SST, MSLP (mean sea level pressure), wind speed (U) and total column water vapour content (WV).
5) Turbulent energy (LH and SH) is calculated using bulk formula in models and the formula vary from model to model, it is essential to use a unified formula system to compare the results.
6) Identify the sources causing the LH differences.
1. LHs from models and Bulk formula have good agreement in general
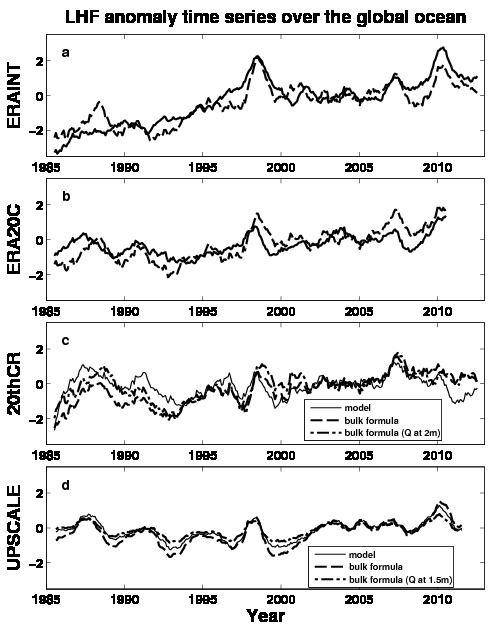
Fig. 1: Anomaly time series of the area mean LH over the global ocean from atmospheric reanalysis (ERAINT, ERA20C and 20thCR) and atmospheric high resolution model simulations (UPSCALE). The reference period is 2001-2005. Twelve month running mean is applied. Lines from UPSCALE are 5 member mean. The LHs calculated from model generated specific humidity at 2m and 1.5 for 20thCR and UPSCALE are also plotted to show the agreement with those using derived specific humidities.
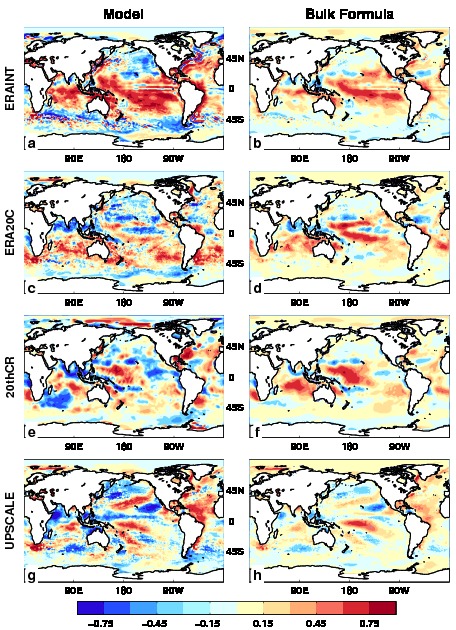
Fig. 2. The LHF trend over 1988-2008 from model output (left column) and bulk formula (right column) for ERAINT, ERA20C, 20thCR and UPSCALE data sets. The spatial correlations over the global ocean are 0.7, 0.6, 0.6 and 0.8, and 0.7, 0.7, 0.8, 0.8 over oceans between 30oS-30oN. The trend unit is W/m2/yr.
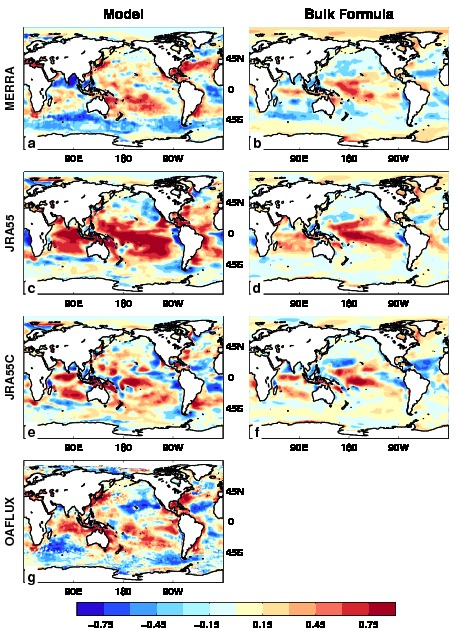
Fig. 2a. As Fig. 2.
2. Sensitivity test of LH variations with different field combinations
ERA20C to ERAINT
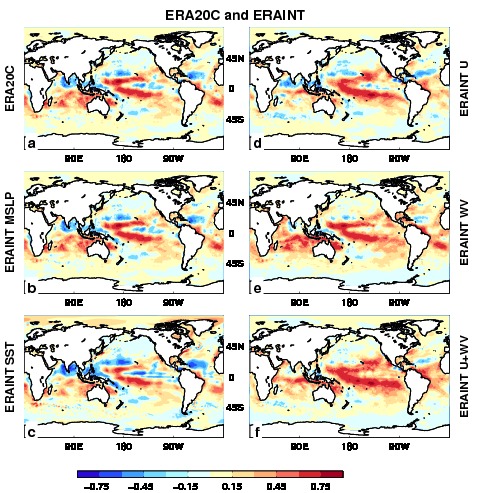
Fig. 3: The LHF trend sensitivity test using bulk formula. (a) ERA20C, (b) using ERAINT MSLP, (c) using ERAINT SST, (d) using ERAINT U, (e) using ERAINT WV and (f) using ERAINT wind and WV.
- Spatial correlations between panel a-f and Fig. 2b are 0.63, 0.63, 0.67, 0.85, 0.71, 0.89, respectively.
- wind and WV are the main causes.
- * using ERAINT SST, means replace ERA20C SST with ERAINT SST.
20thCR to ERAINT
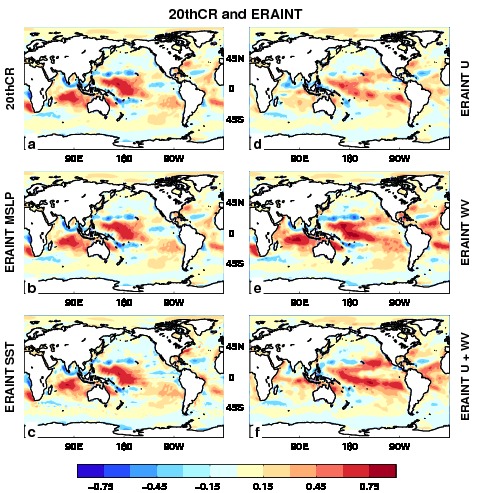
Fig. 4: The LHF trend sensitivity test using bulk formula. (a) 20thCR, (b) using ERAINT MSLP, (c) using ERAINT SST, (d) using ERAINT U, (e) using ERAINT WV and (f) using ERAINT wind and WV.
- Spatial correlations between panel a-f and Fig. 2b are 0.51, 0.51, 0.62, 0.80, 0.66, and 0.89, respectively.
- Wind and WV are the main causes, but wind is the main one in this case.
- WV increase the LH over Indian Ocean.
UPSCALE to ERAINT
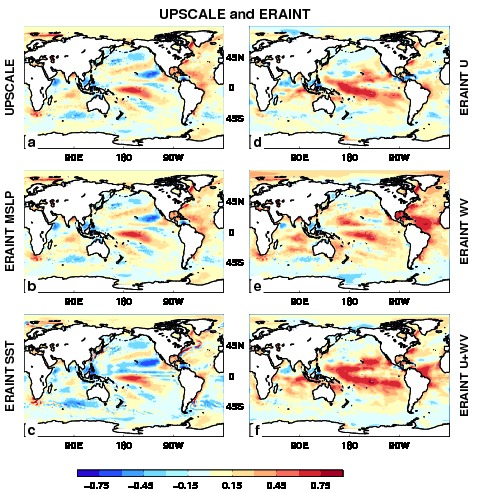
Fig. 5: The LHF trend sensitivity test using bulk formula. (a) UPSCALE, (b) using ERAINT MSLP, (c) using ERAINT SST, (d) using ERAINT U, (e) using ERAINT WV and (f) using ERAINT wind and WV.
- UPSCALE has 5 members with high resolution.
SSM/I to ERAINT
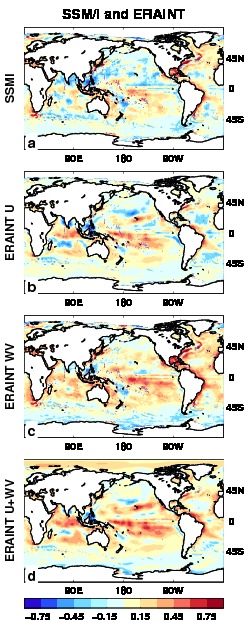
Fig. 6: The LHF trend sensitivity test using bulk formula. (a) SSM/I, (b) using ERAINT U, (c) using ERAINT WV and (d) using ERAINT wind and WV.
- SSM/I data set only have wind and water vapour, so SST and MSLP are from ERAINT data interpolation to SSM/I grid.
- Compared with Fig 2b, Fig 6d is weaker, due to the interpolation of the field.
3. Sources of discrepancies
Trends of SST, MSLP, U and WV
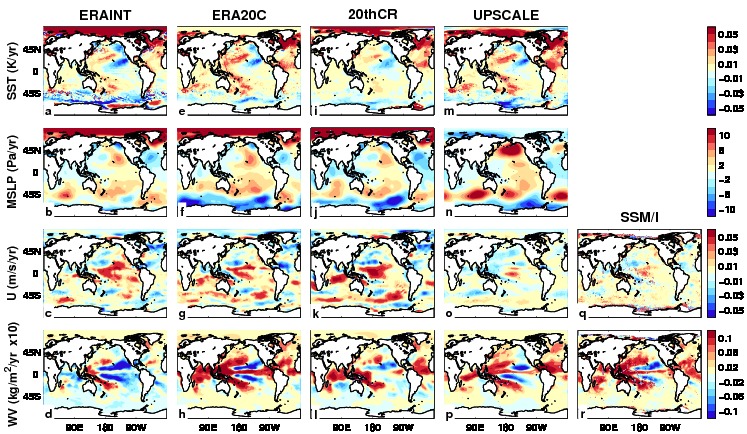
Fig. 7: Trends of 4 variables from different data sets.
- Wind trend of 5 UPSCALE member mean is very similar to that from SSM/I.
- For water vapour (WV), ERAINT is the outlier.
- The WV trends was studied by Allan et al 2014 (Surveys in Geophysics).
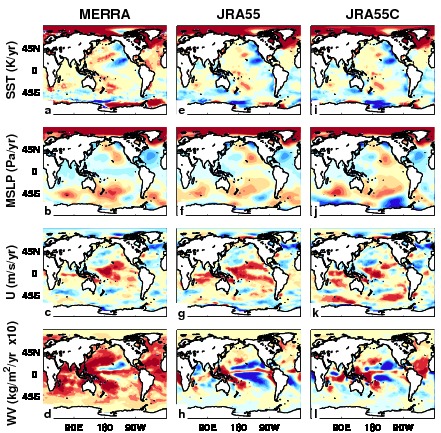
Fig. 8: As Fig. 7, but for MERRA, JRA55, JRA55C data sets.