Number of elements in m and c vectors 8
Number of observation vectors 80
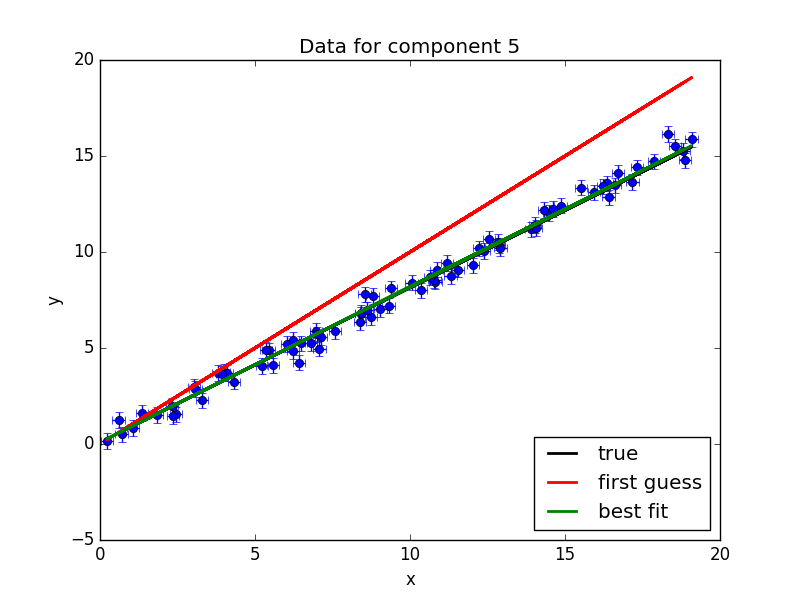
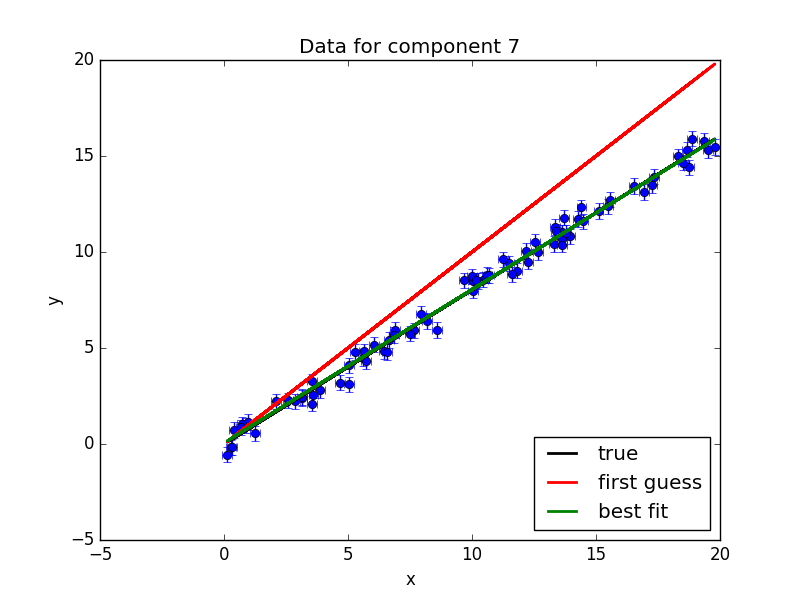
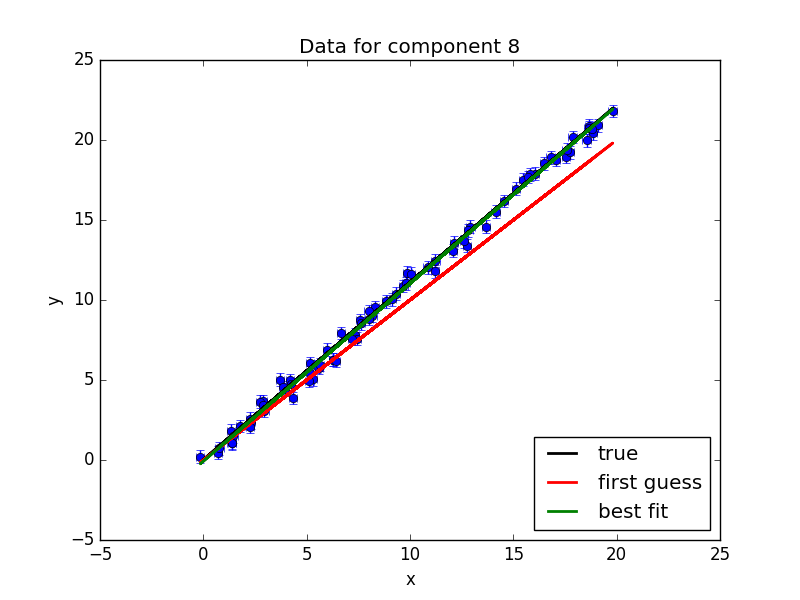
Synthetic data
c and m solved simultaneously
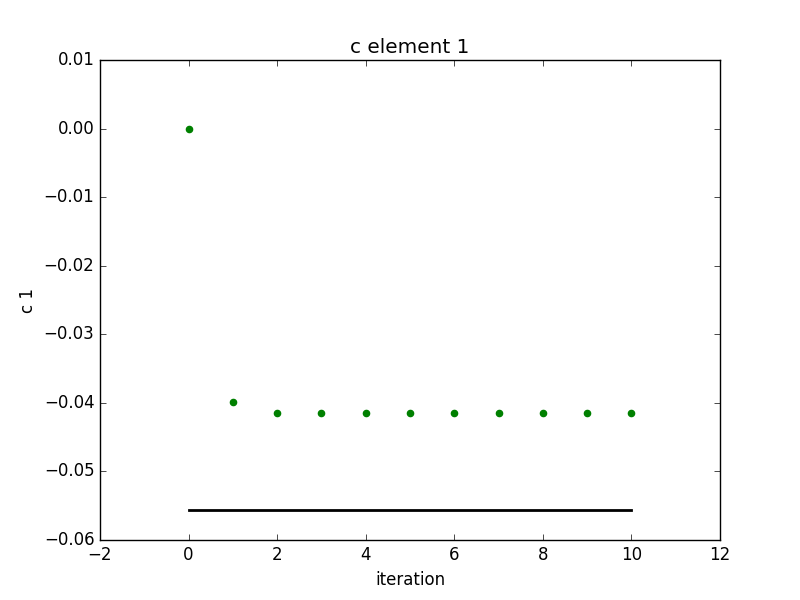
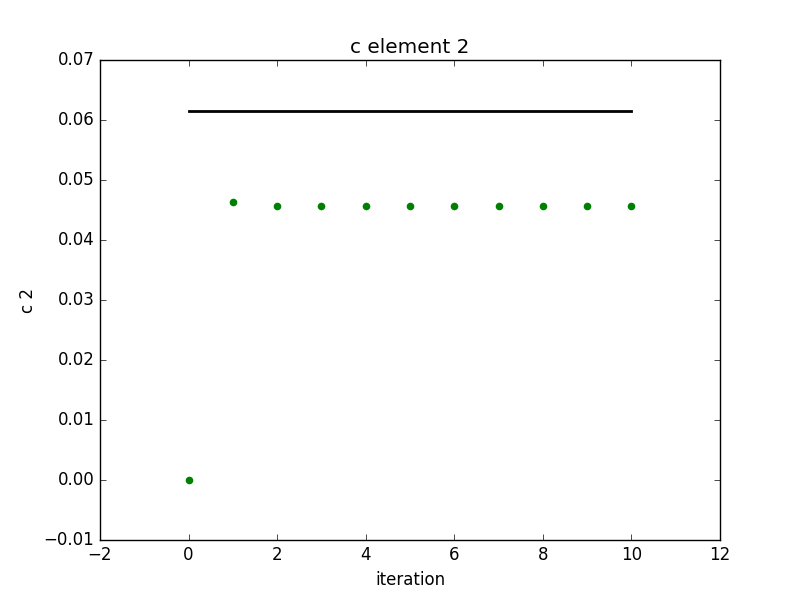
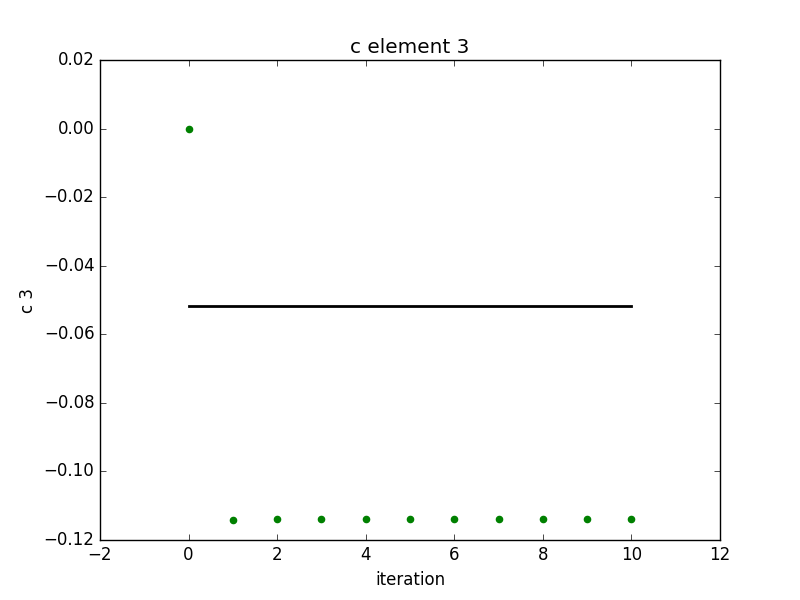
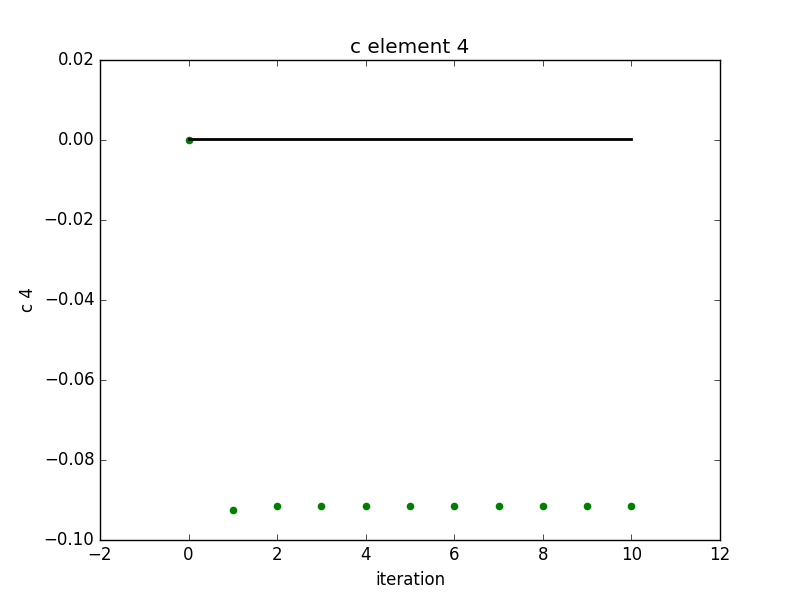
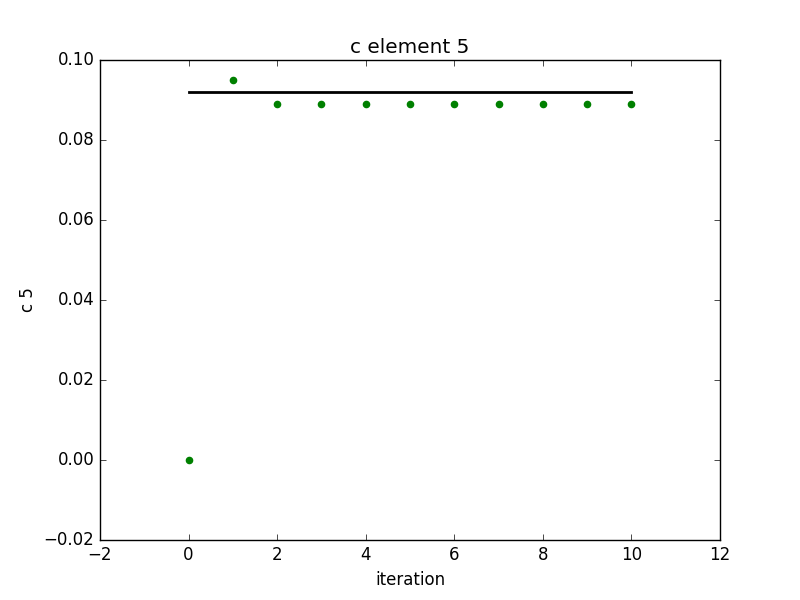
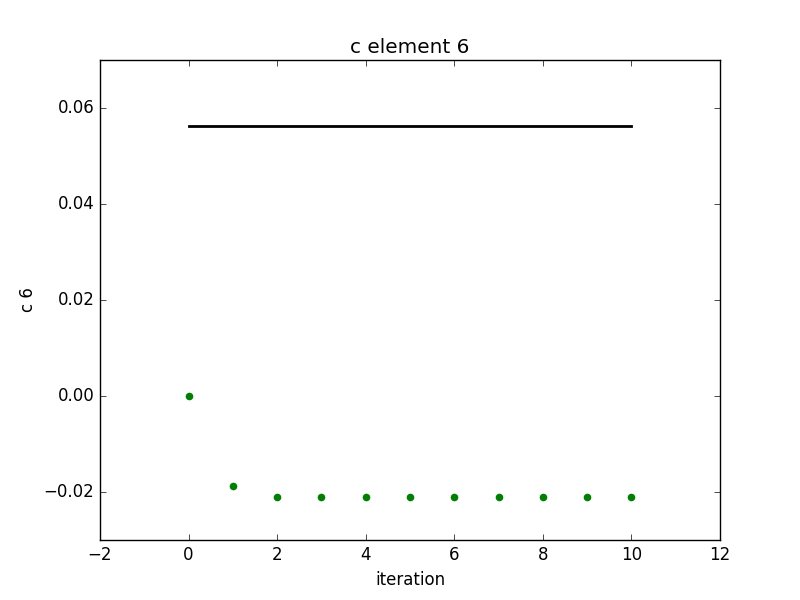
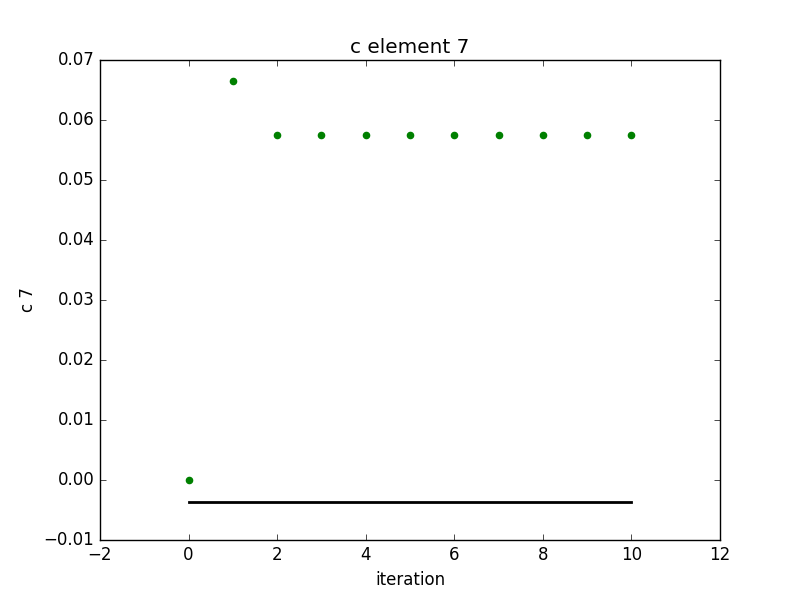
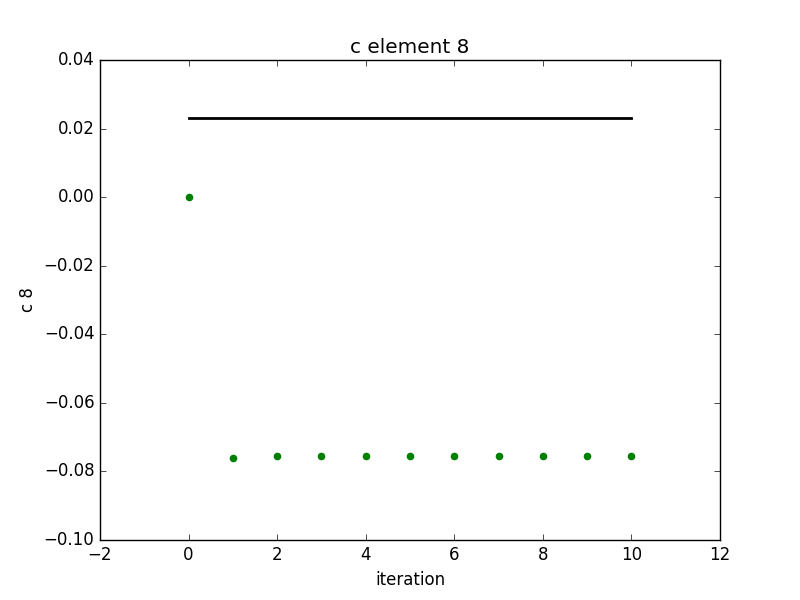
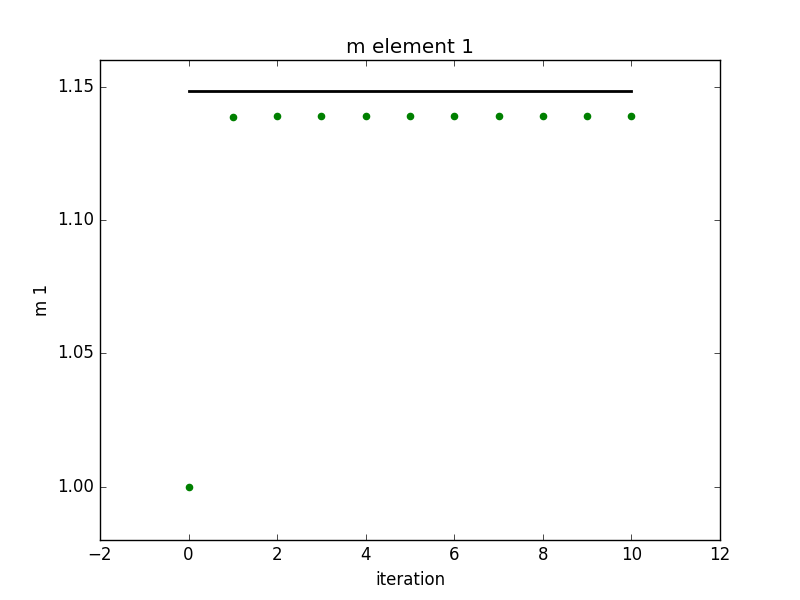
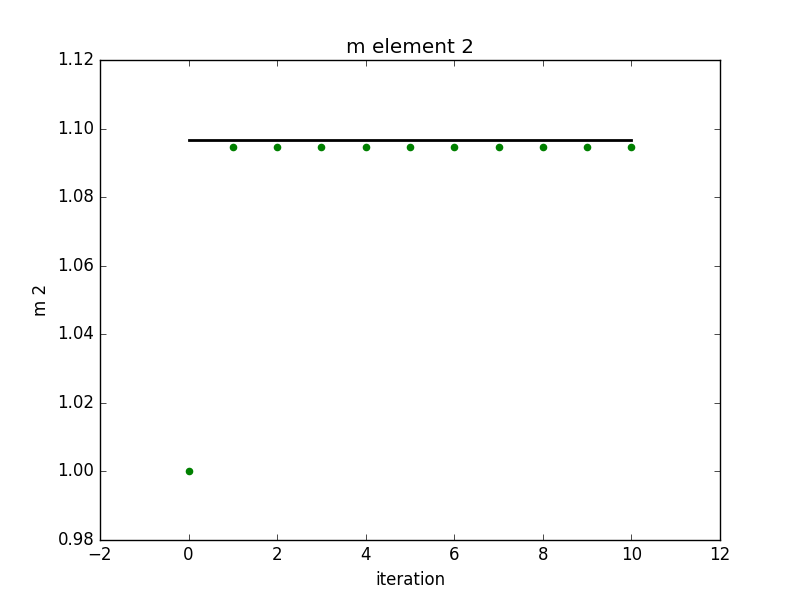
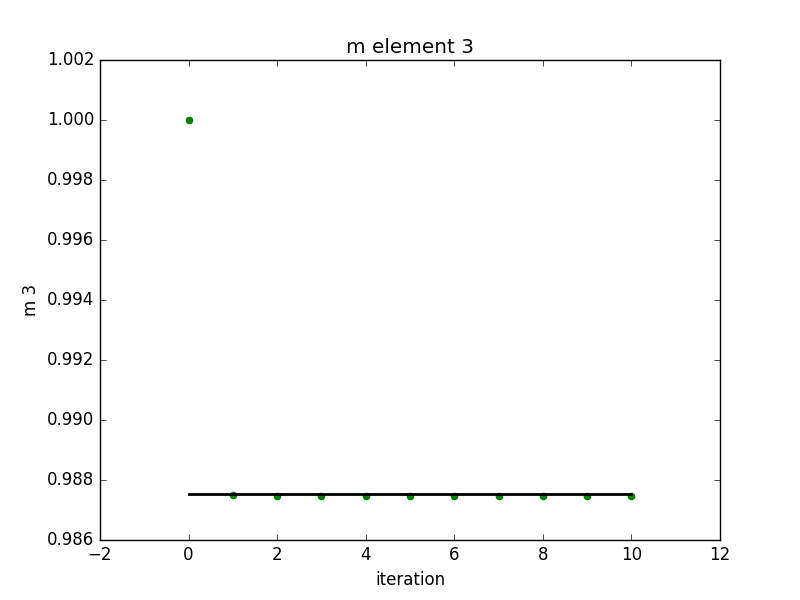
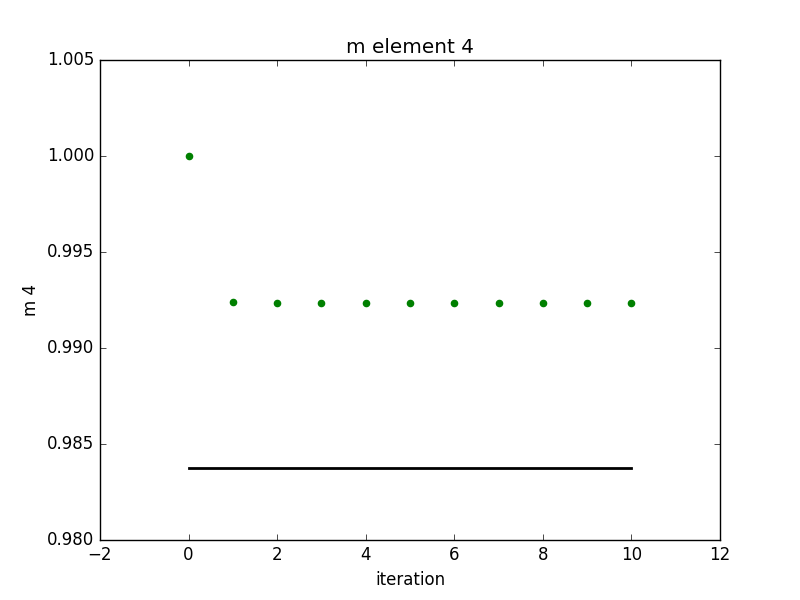
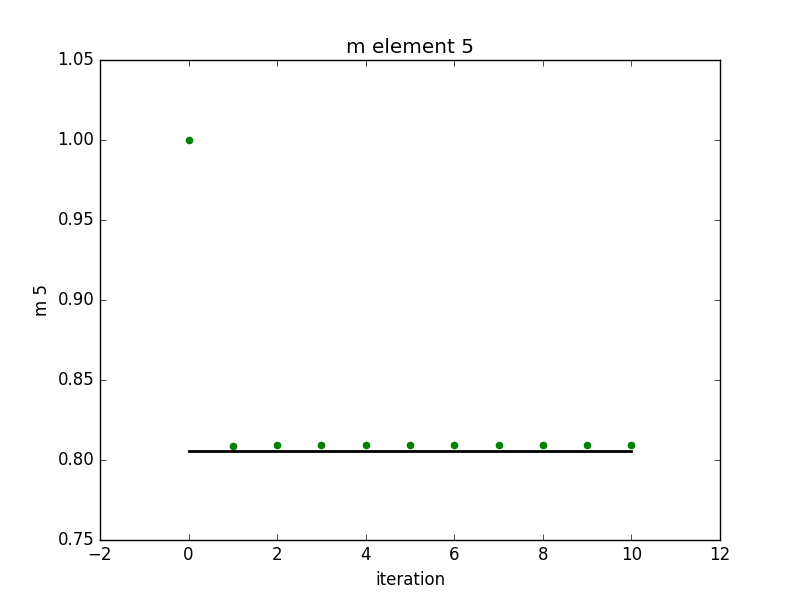
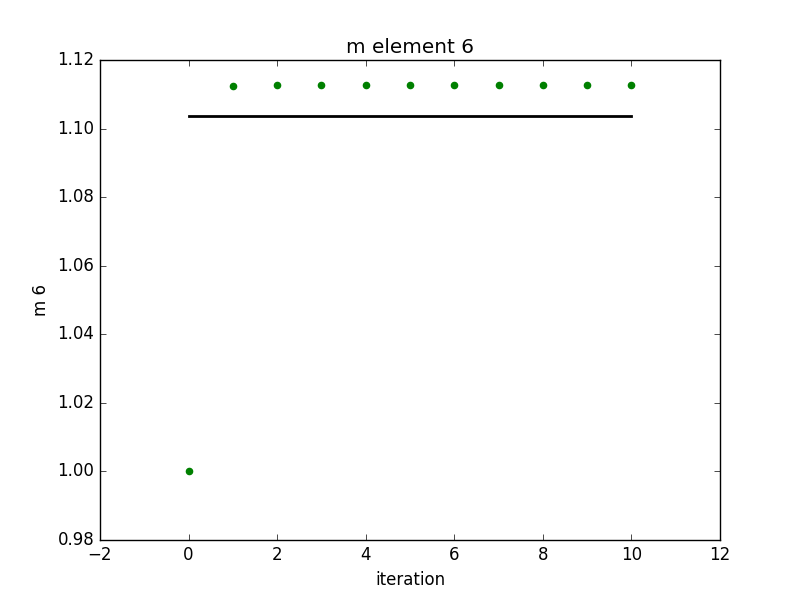
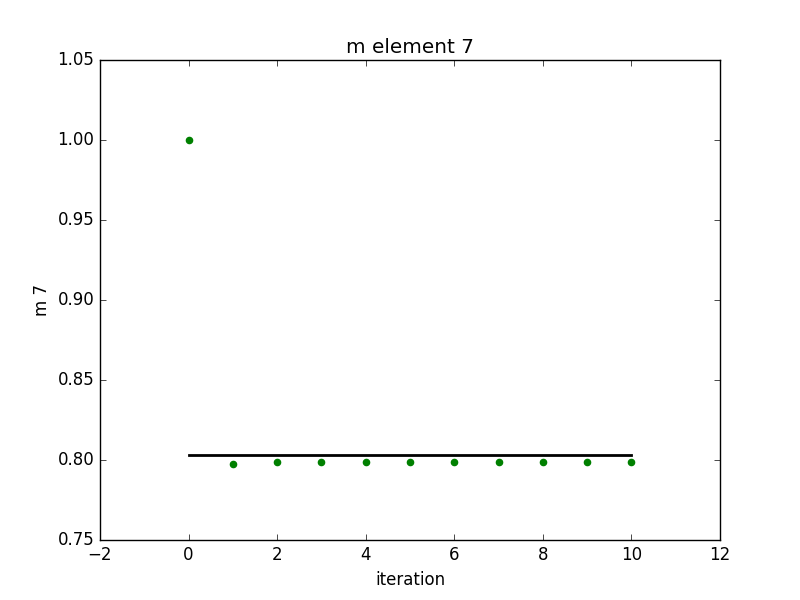
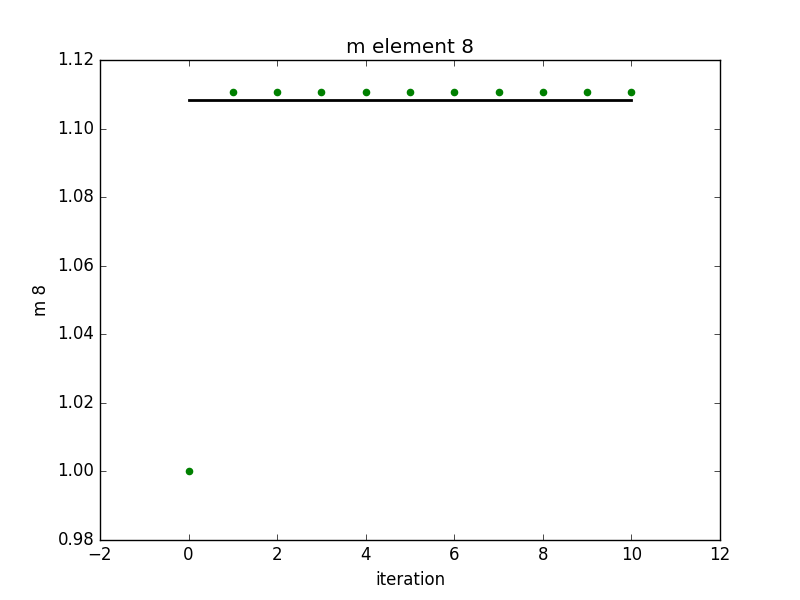
Elements of c and m with iteration
(black is truth)
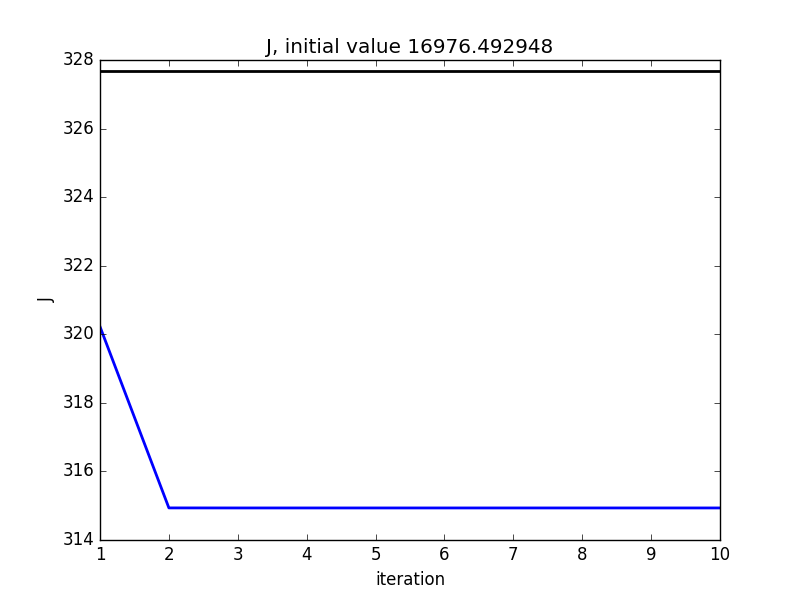
Cost function with iteration
(black is J at truth)
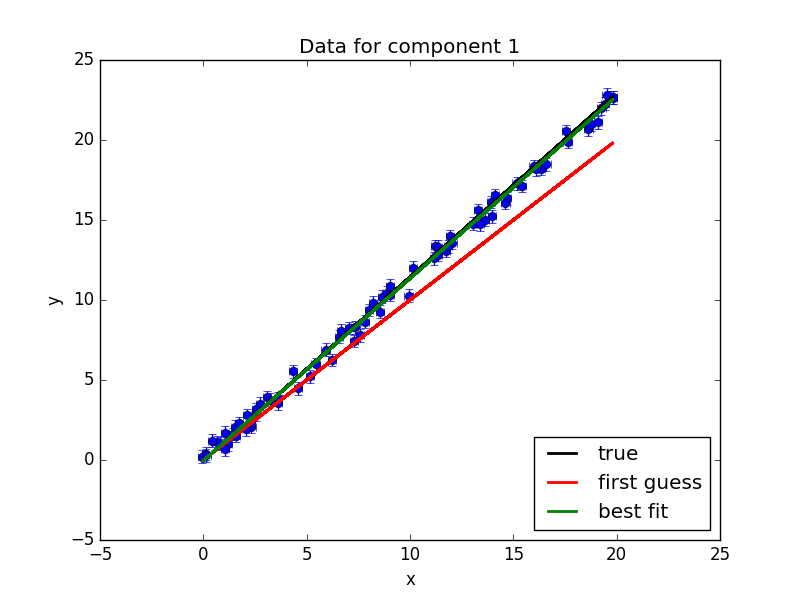
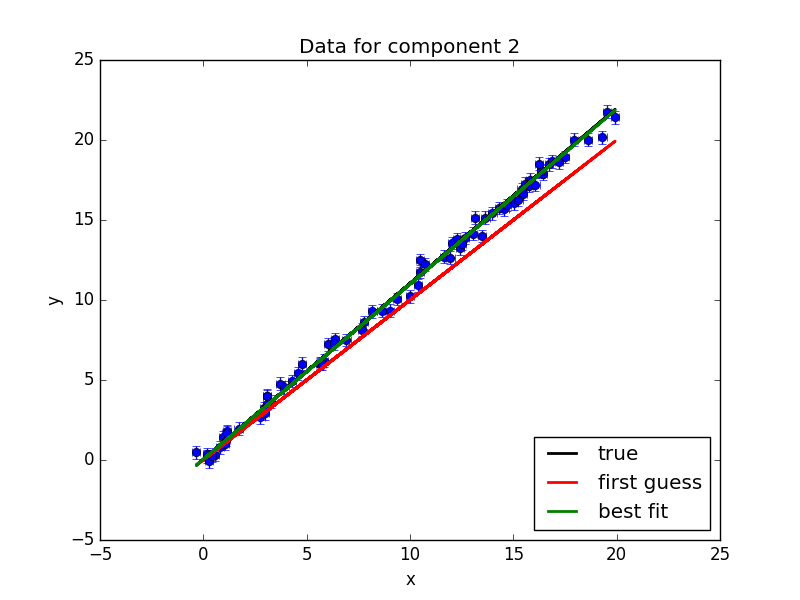
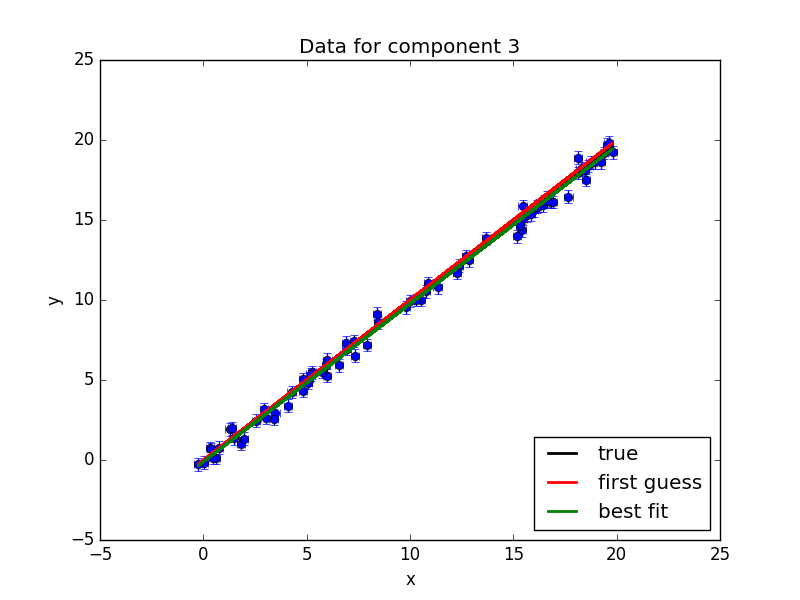
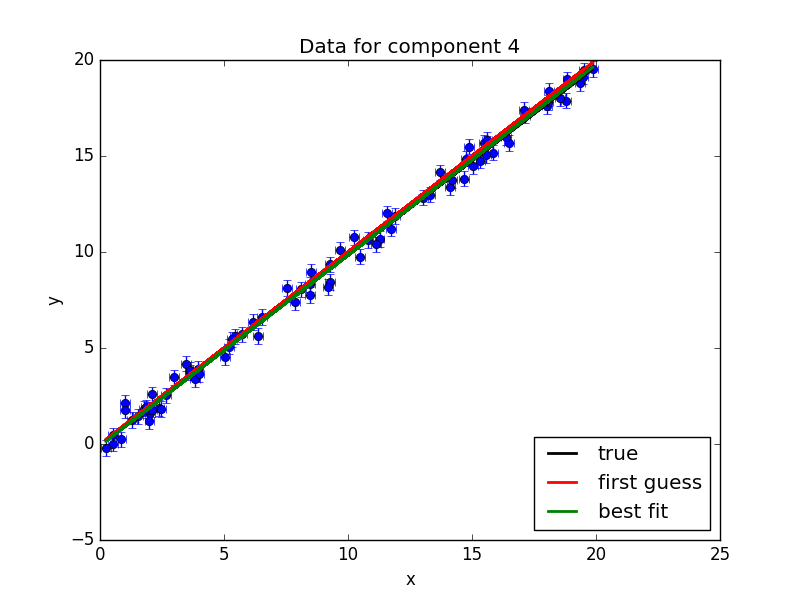
Scatter plots with lines
| Final regression values |
|---|
| c |
| -0.041541 |
0.045668 |
-0.11377 |
-0.091584 |
0.088937 |
-0.02106 |
0.057579 |
-0.07555 |
| m |
| 1.138829 |
1.094717 |
0.987456 |
0.992324 |
0.80918 |
1.112581 |
0.798651 |
1.110754 |
| True values |
|---|
| c |
| -0.055627 |
0.061442 |
-0.051824 |
0.000142 |
0.092122 |
0.056313 |
-0.003623 |
0.02297 |
| m |
| 1.148326 |
1.096763 |
0.987529 |
0.983732 |
0.805659 |
1.103718 |
0.803085 |
1.10831 |