Number of elements in m and c vectors 19
Number of observation vectors 816
Real data
c and m solved simultaneously
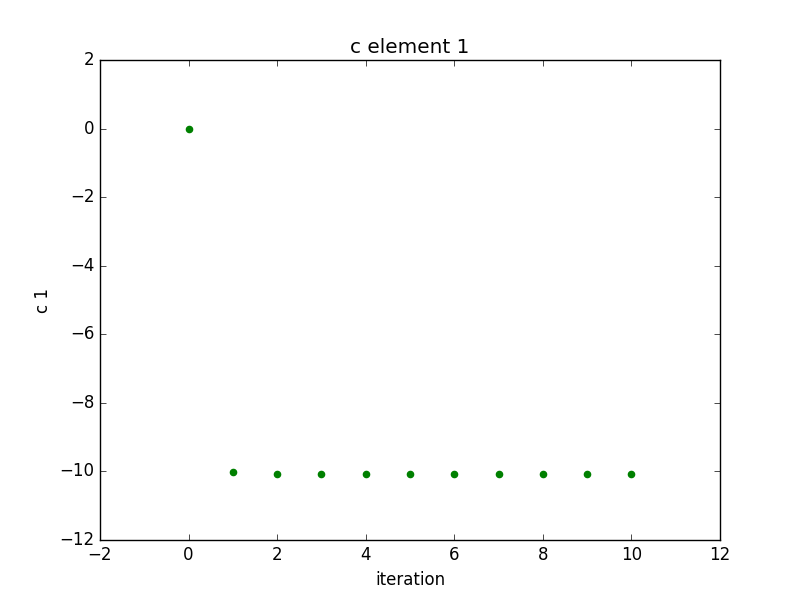
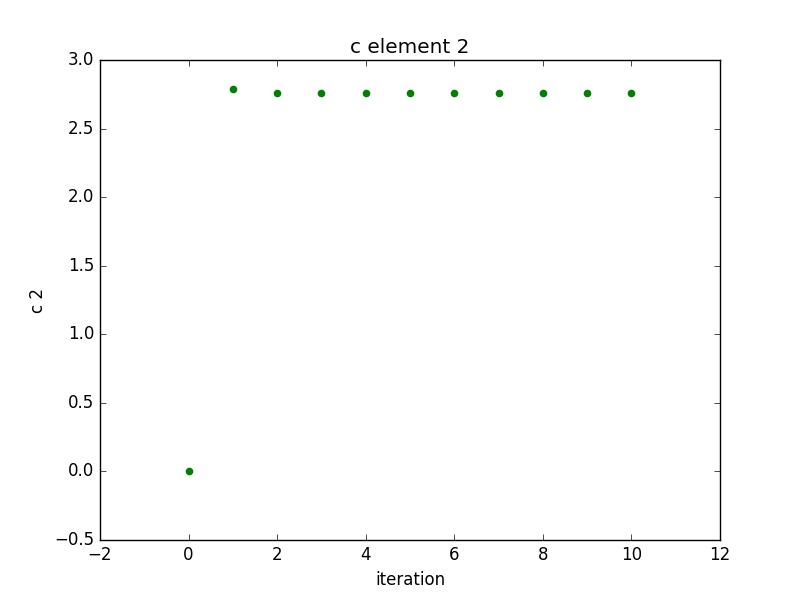
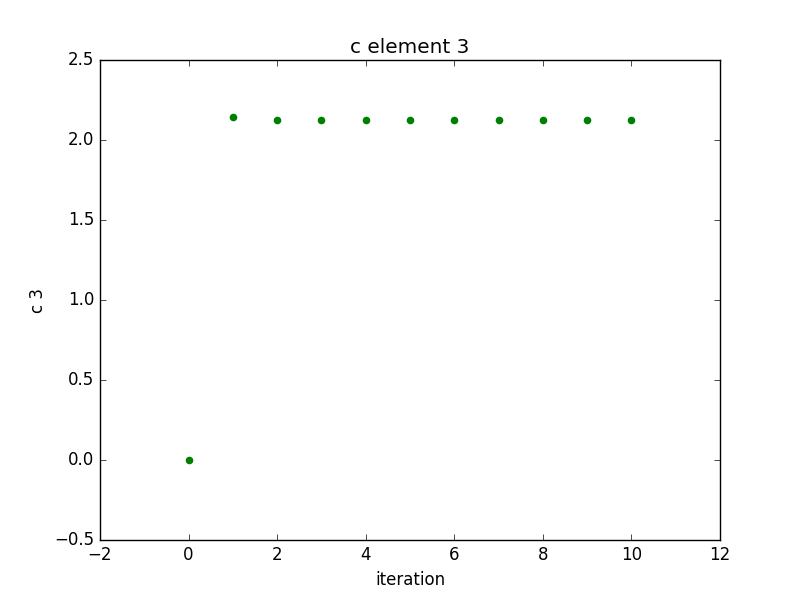
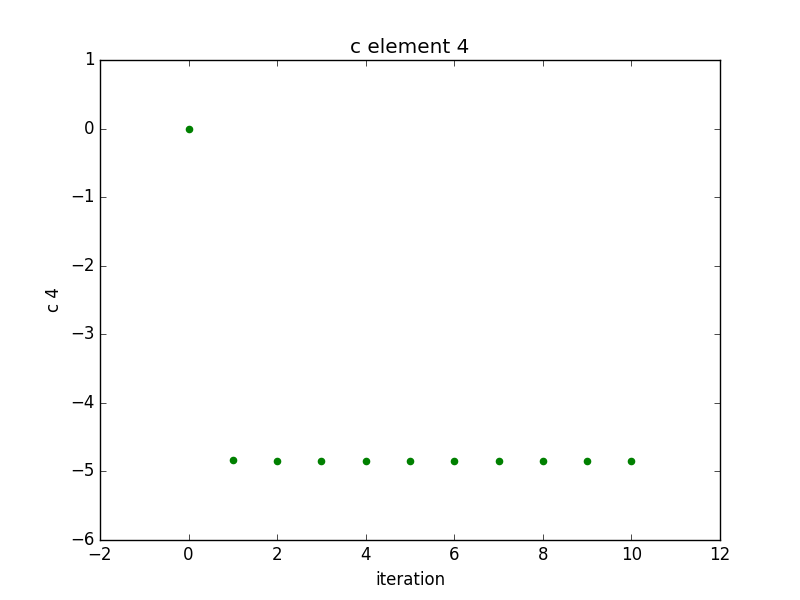
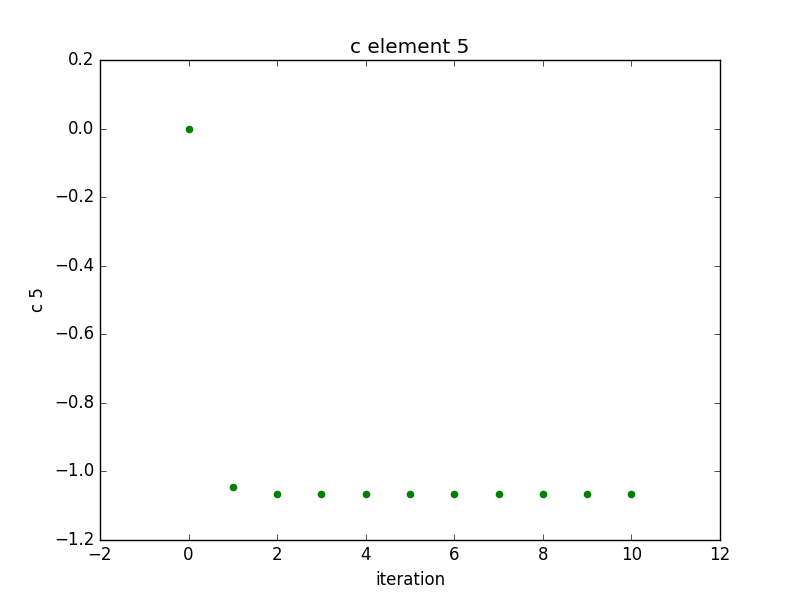
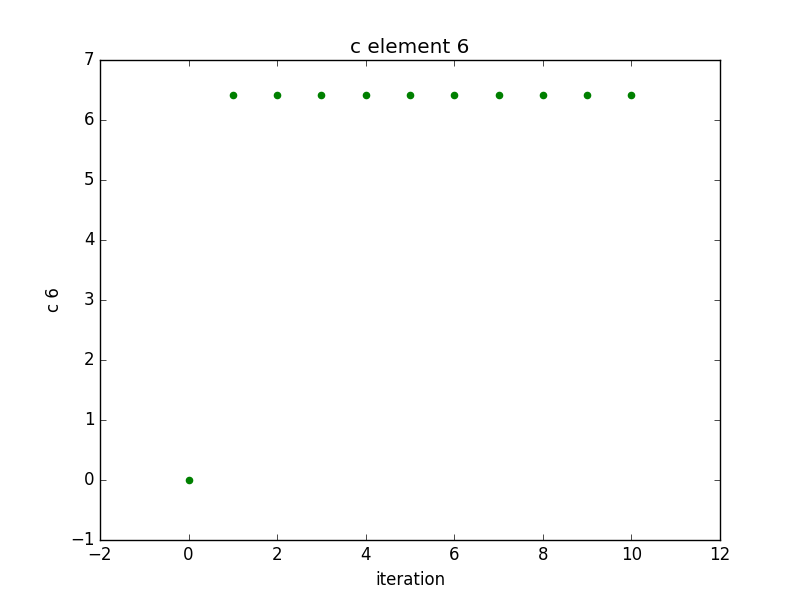
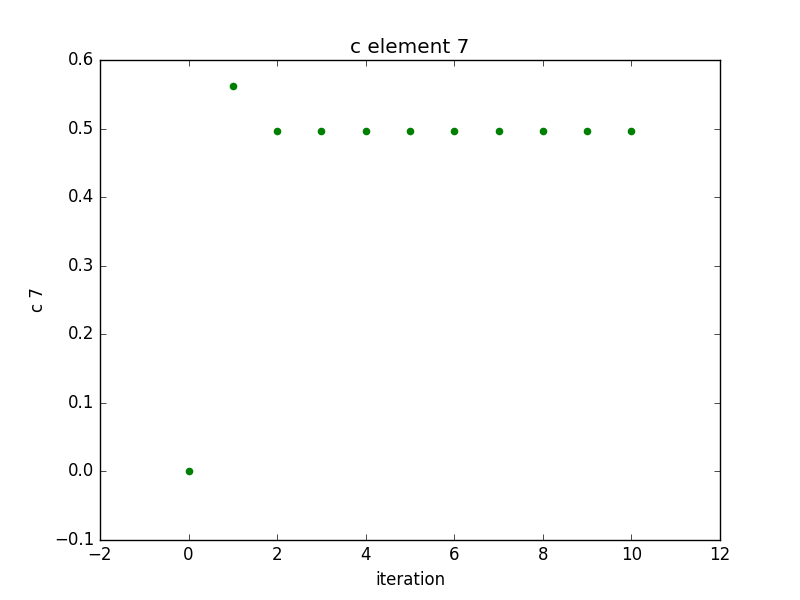
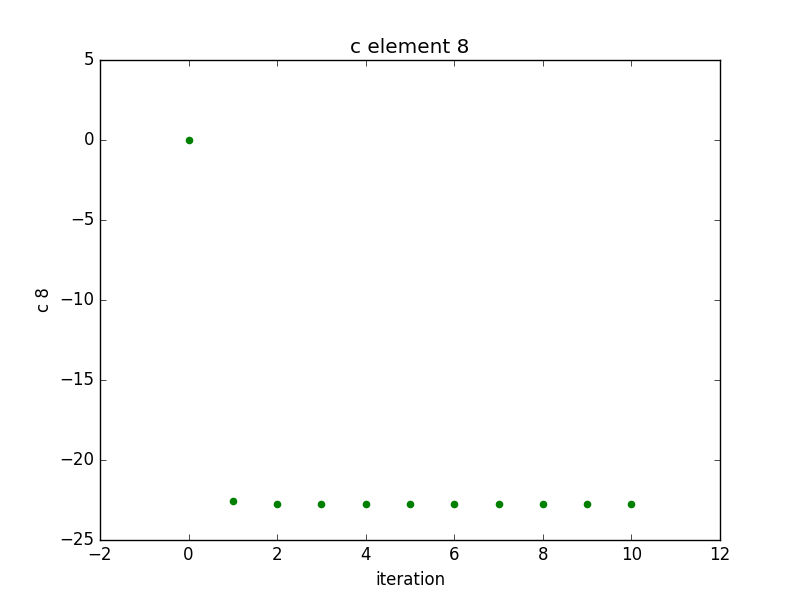
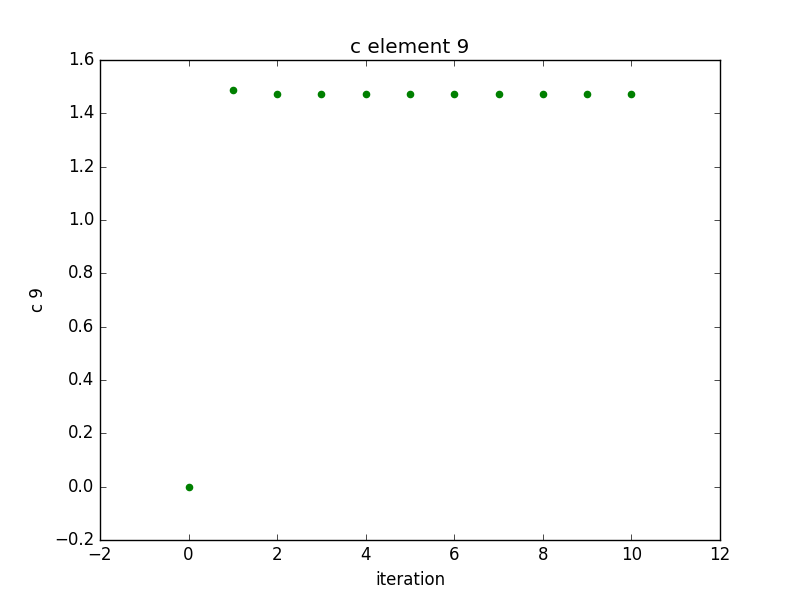
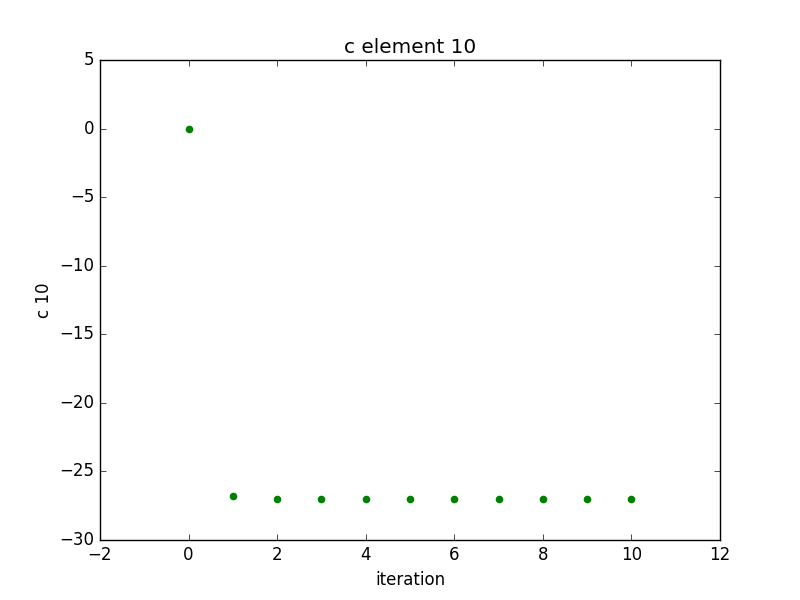
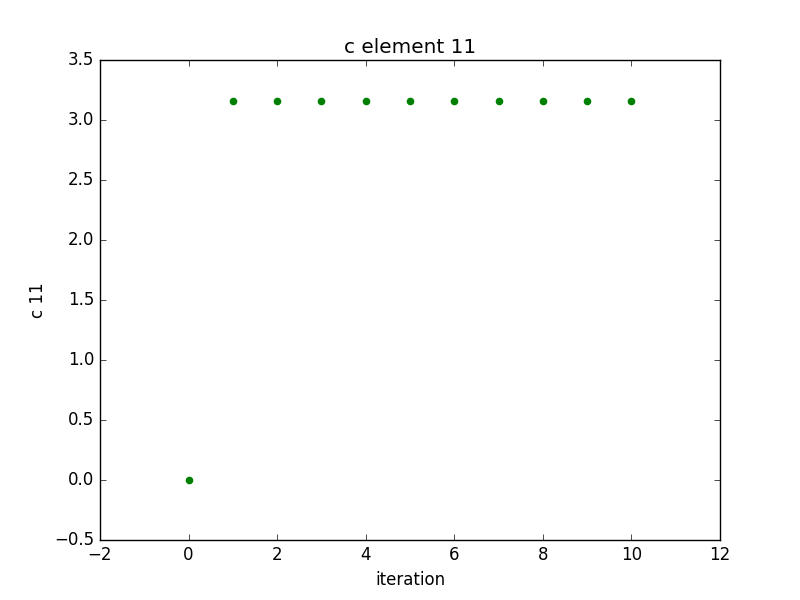
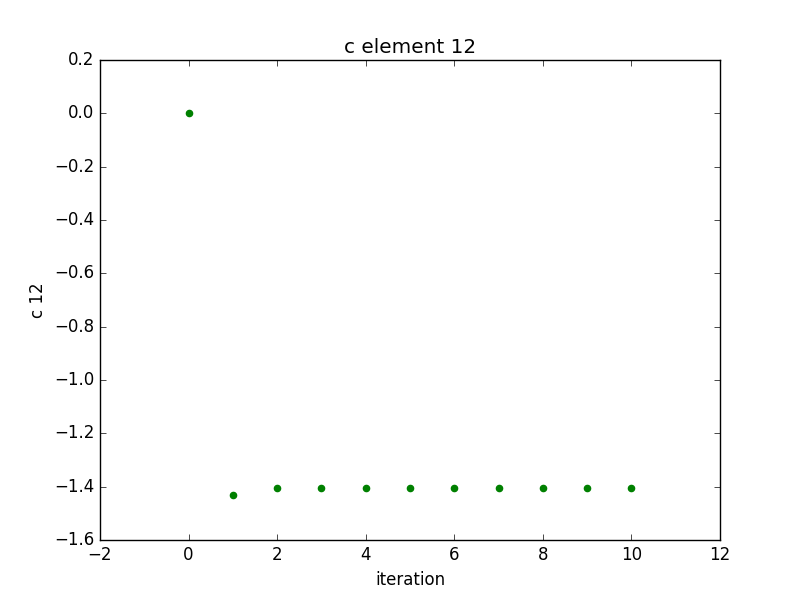
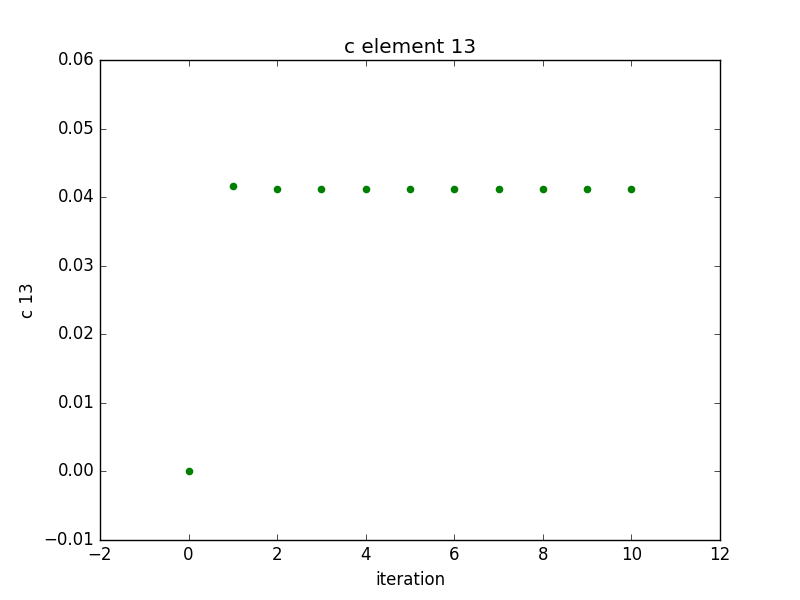
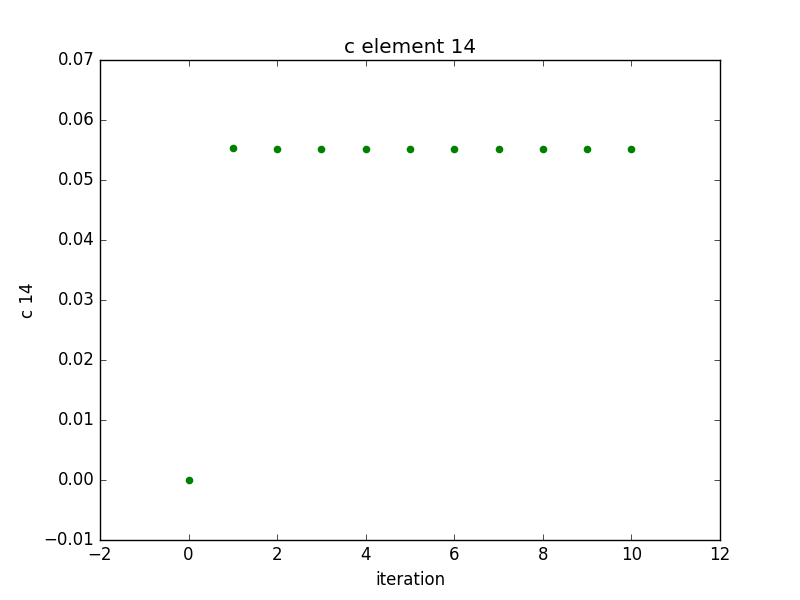
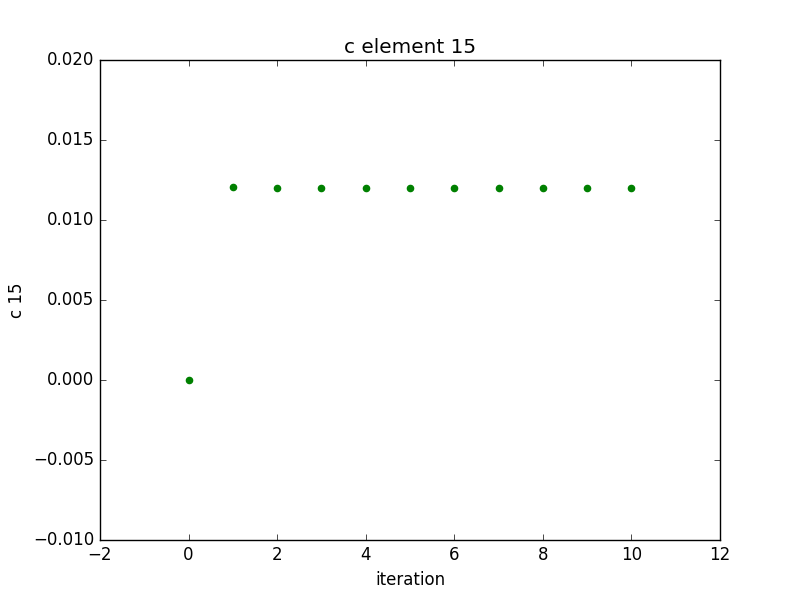
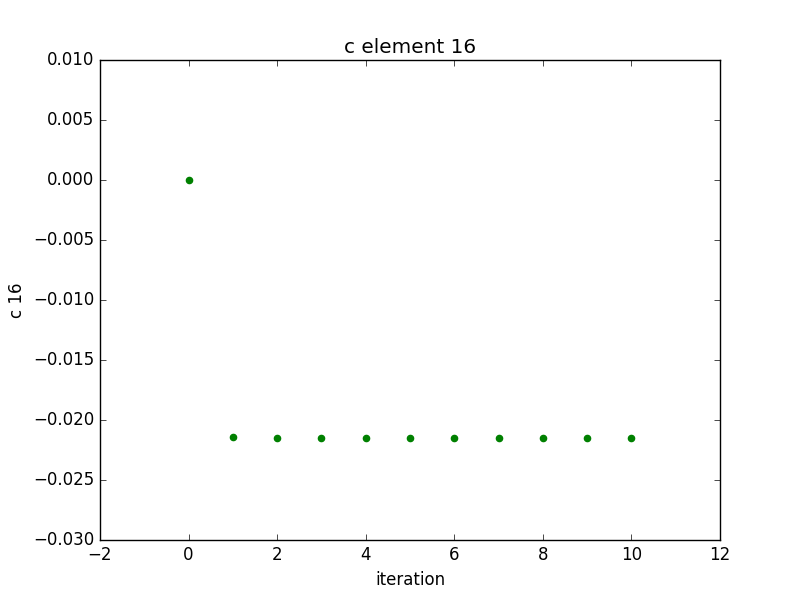
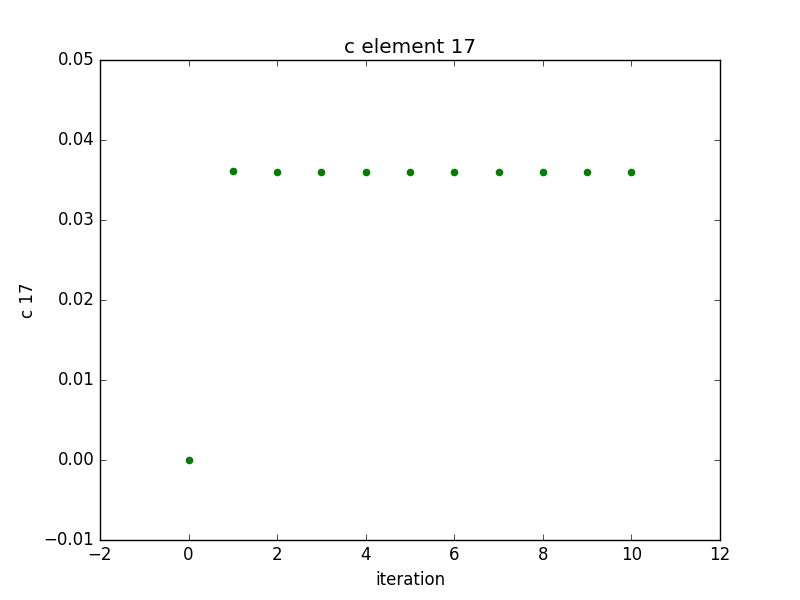
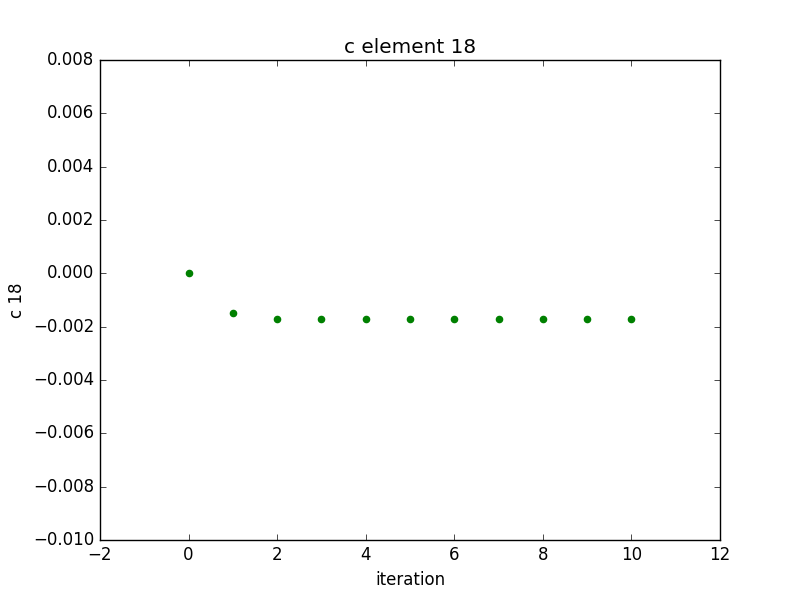
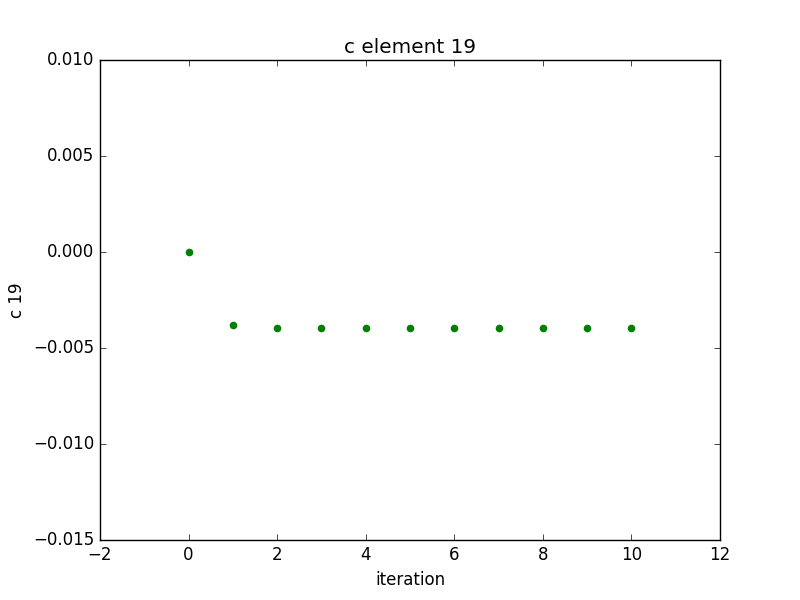
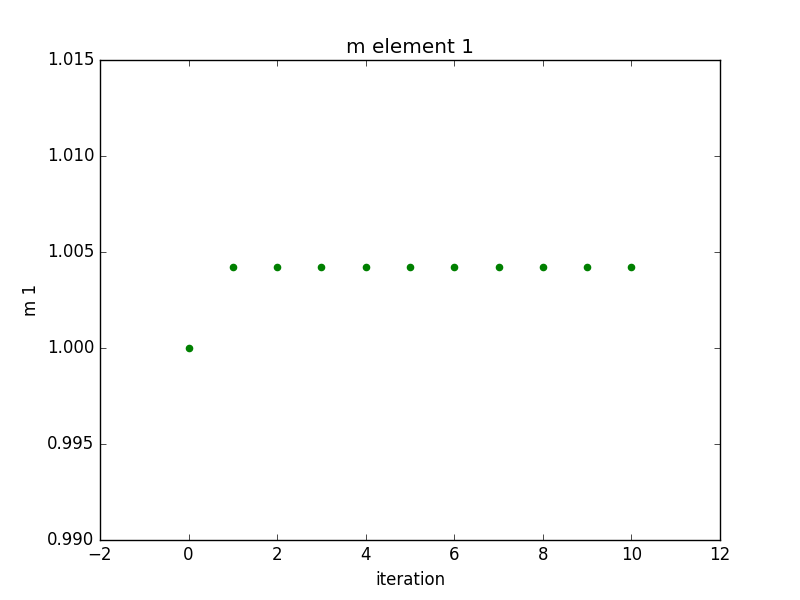
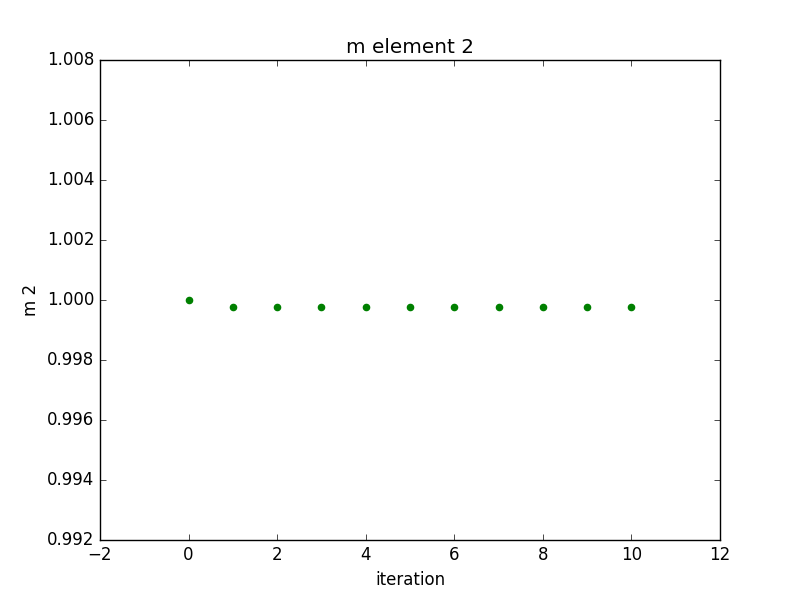
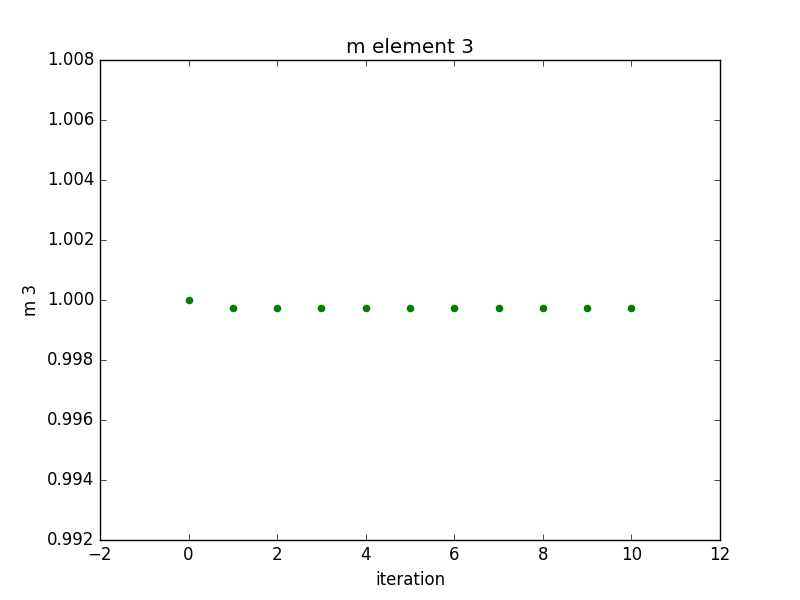
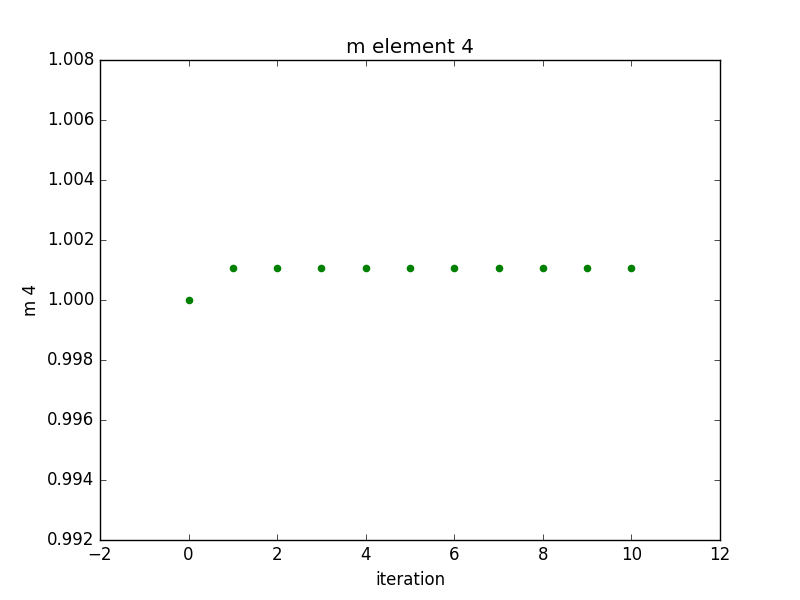
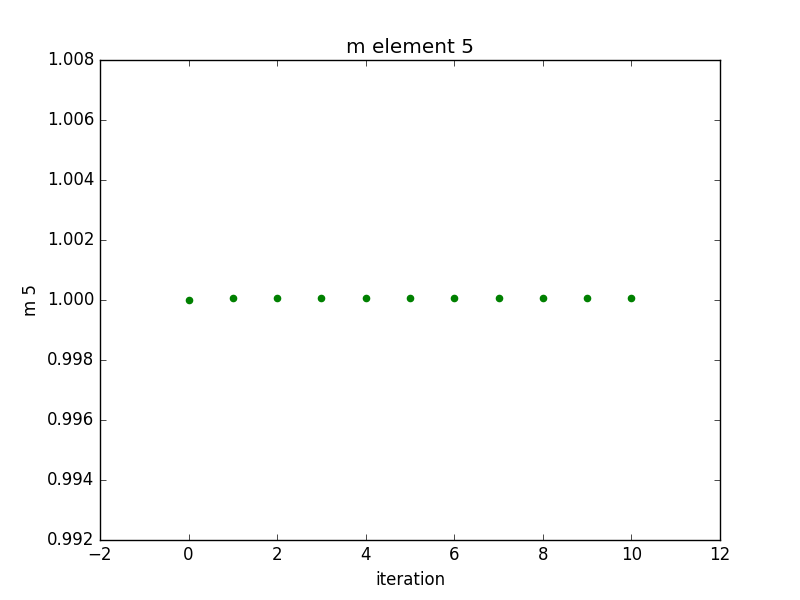
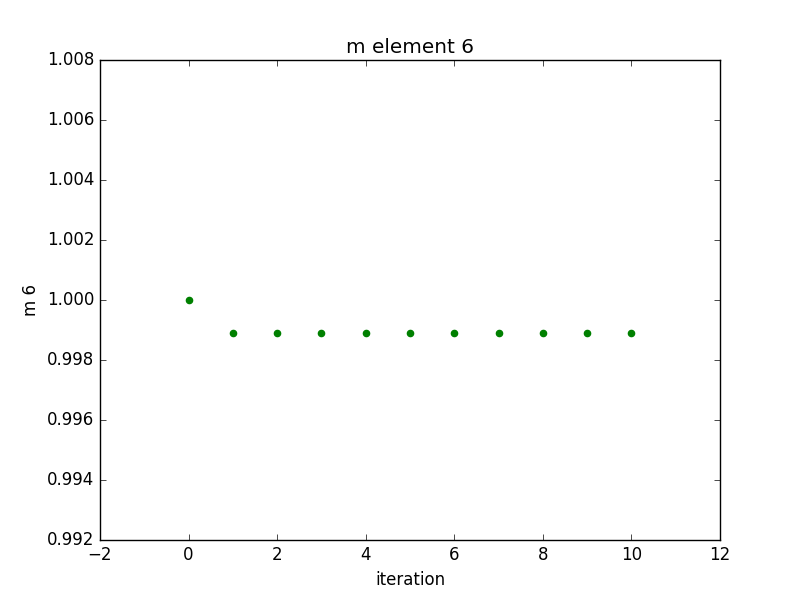
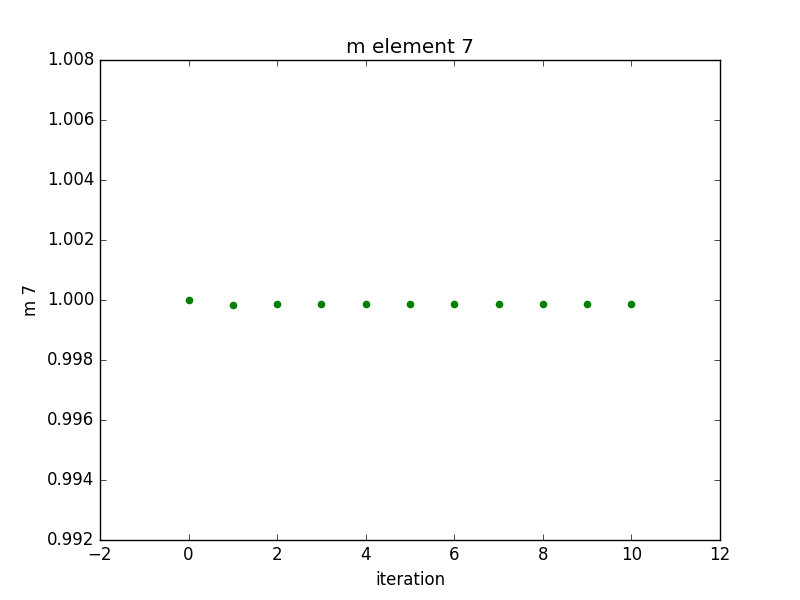
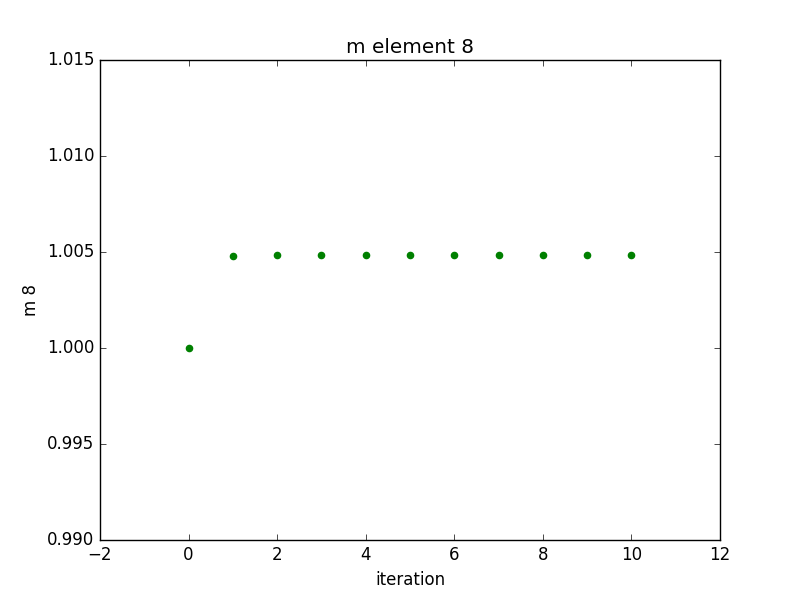
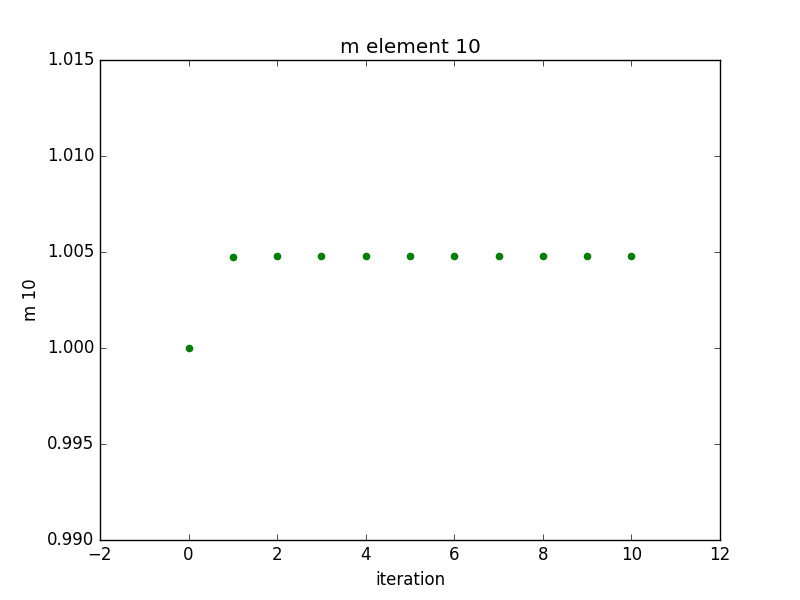
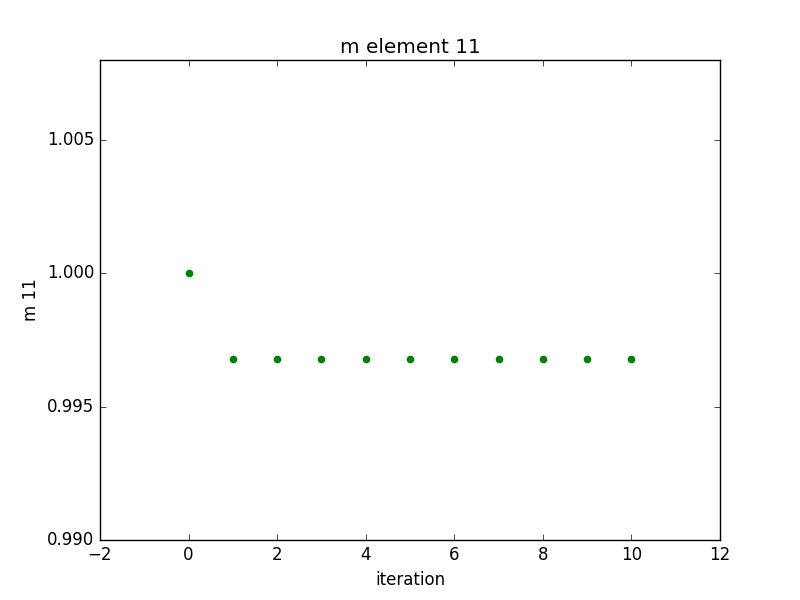
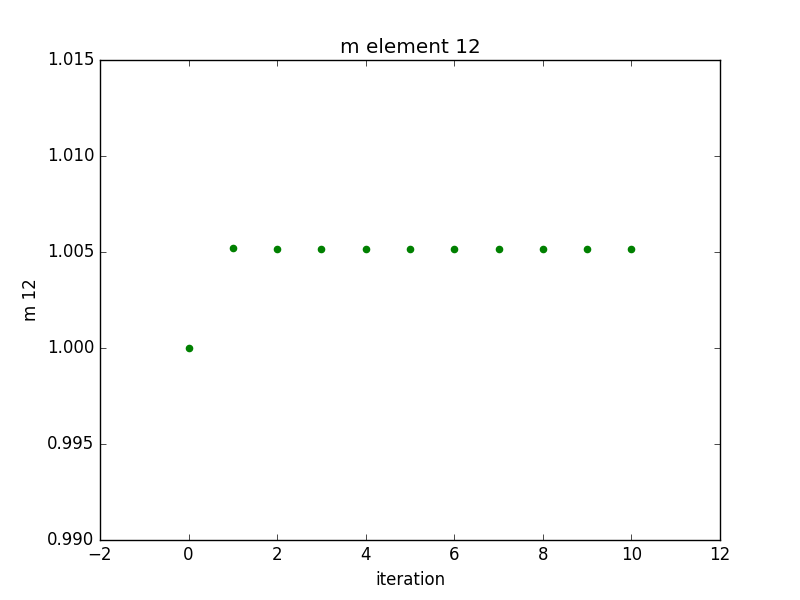
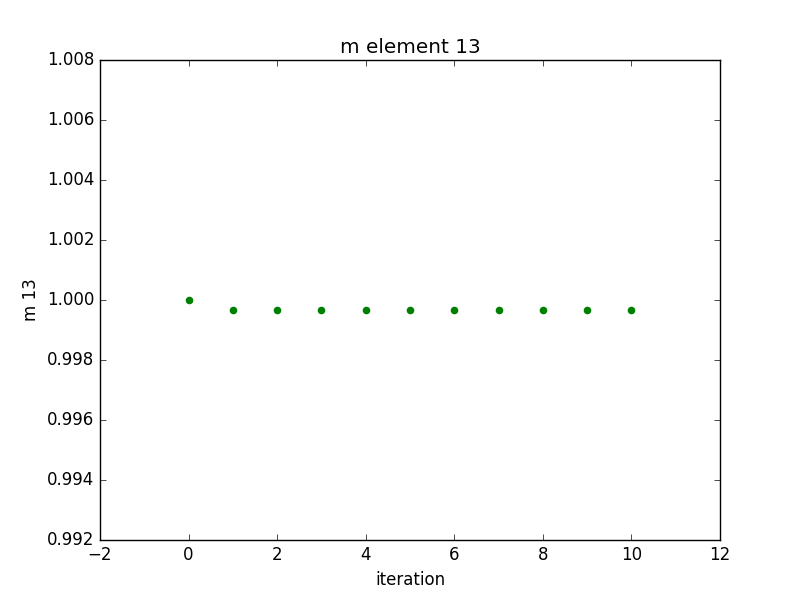
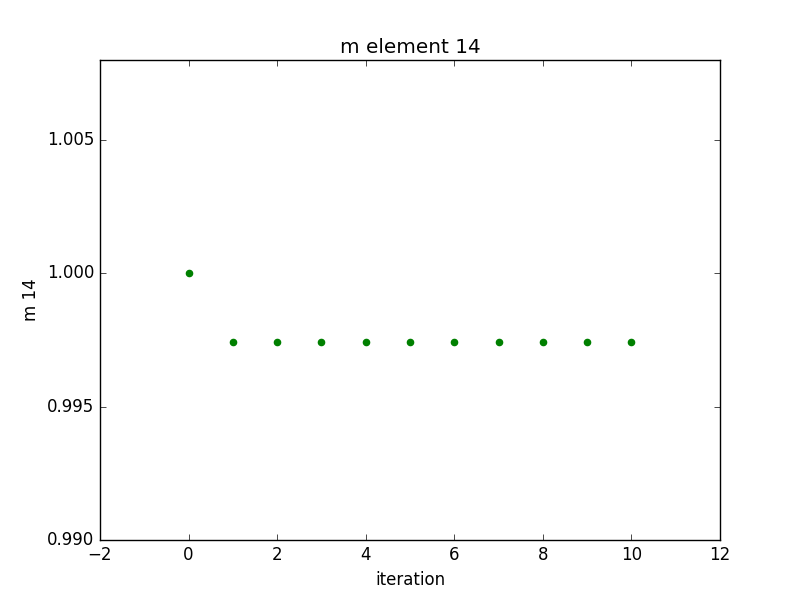
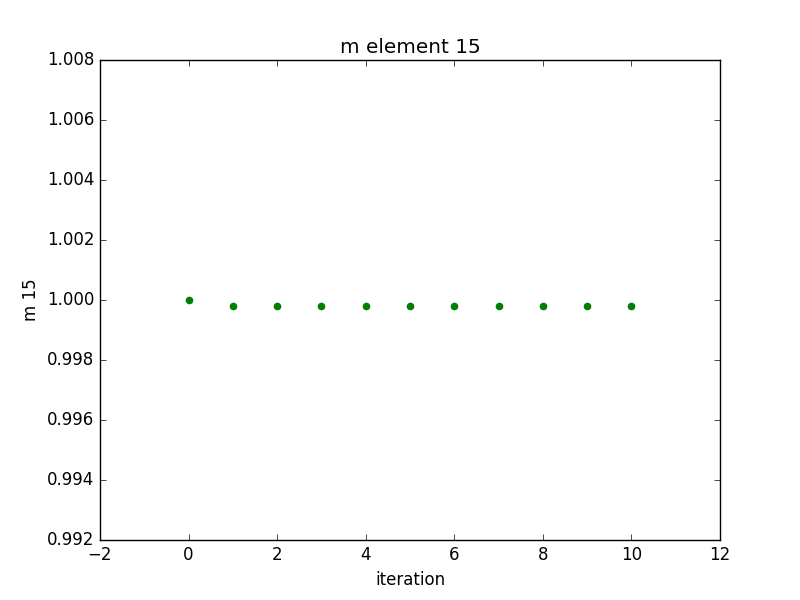
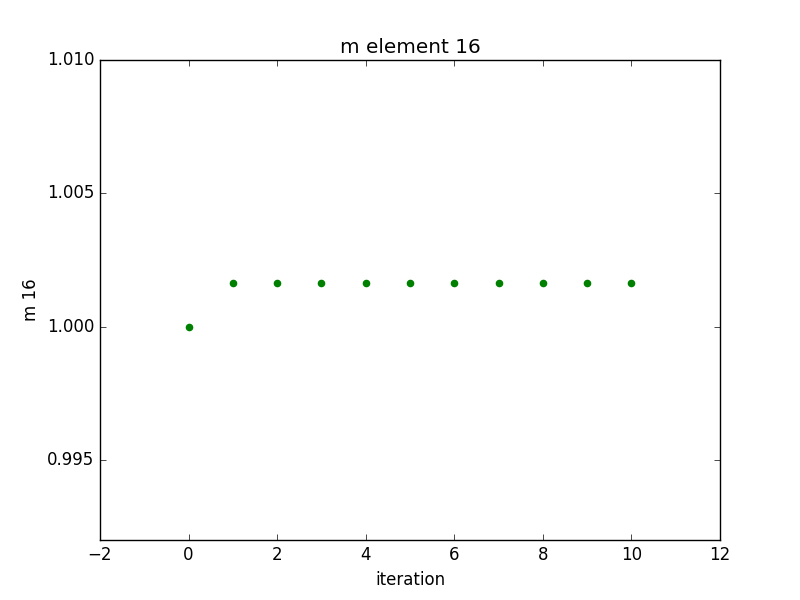
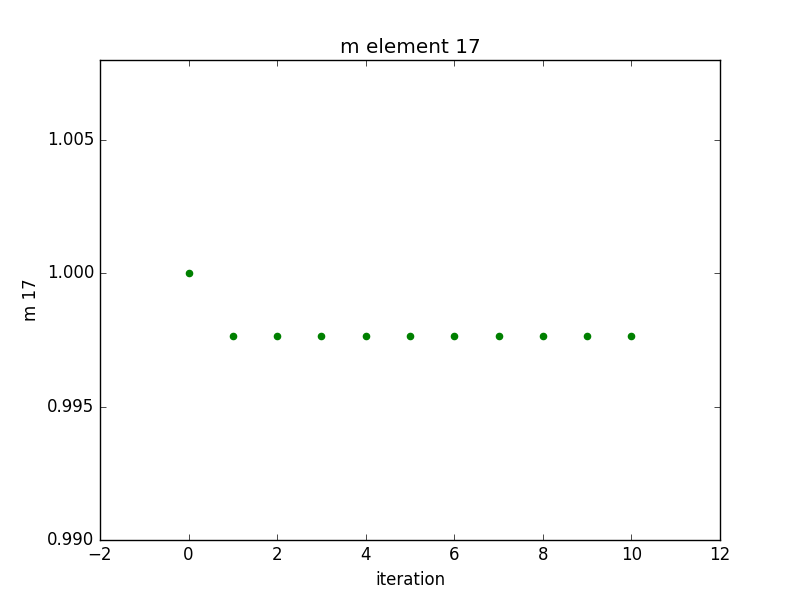
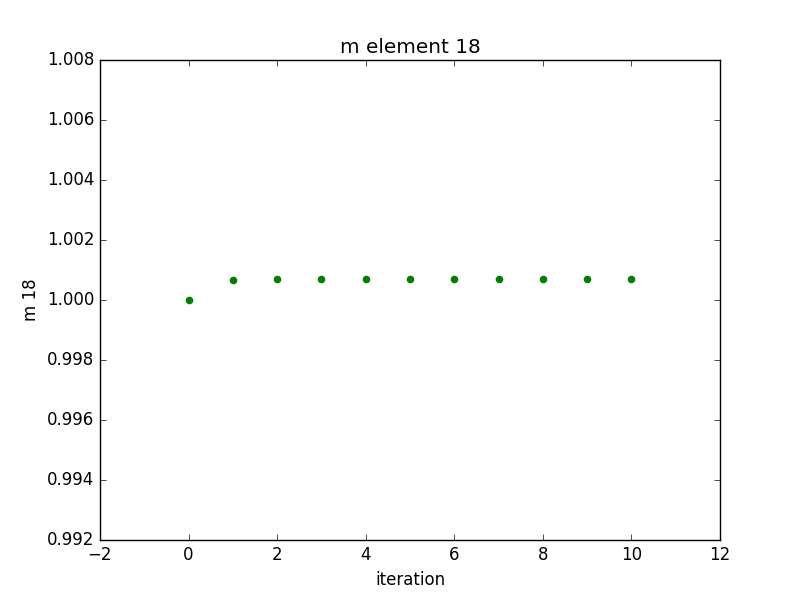
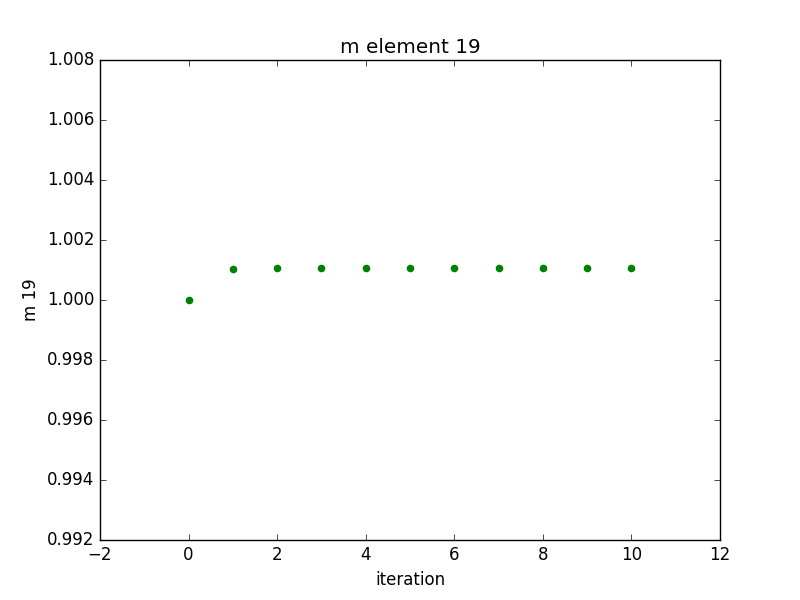
Elements of c and m with iteration
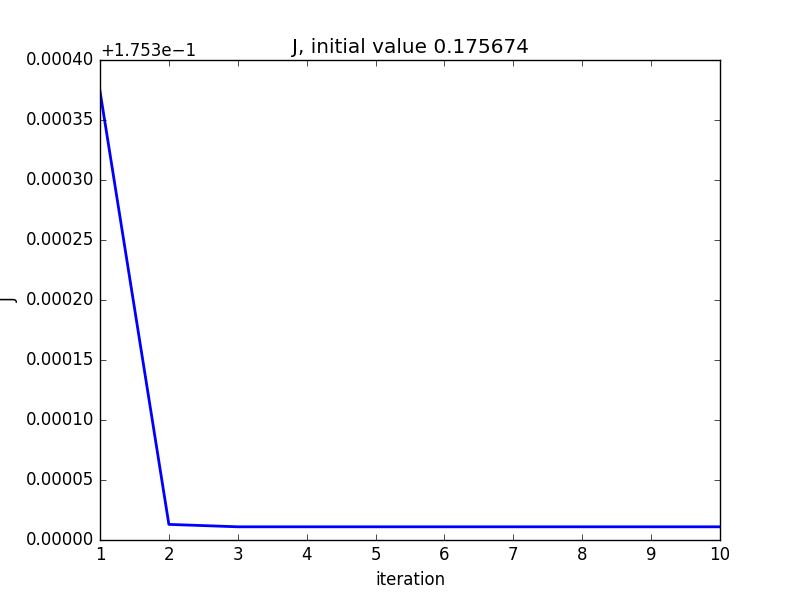
Cost function with iteration
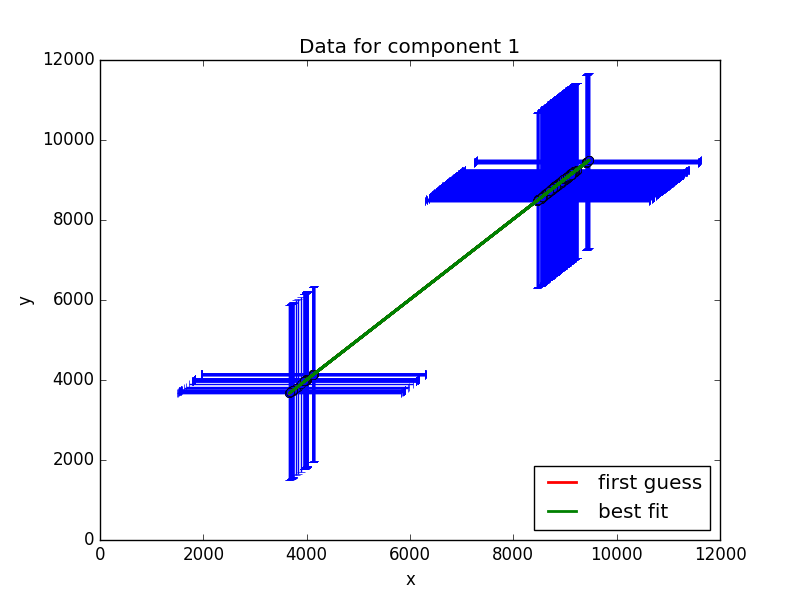
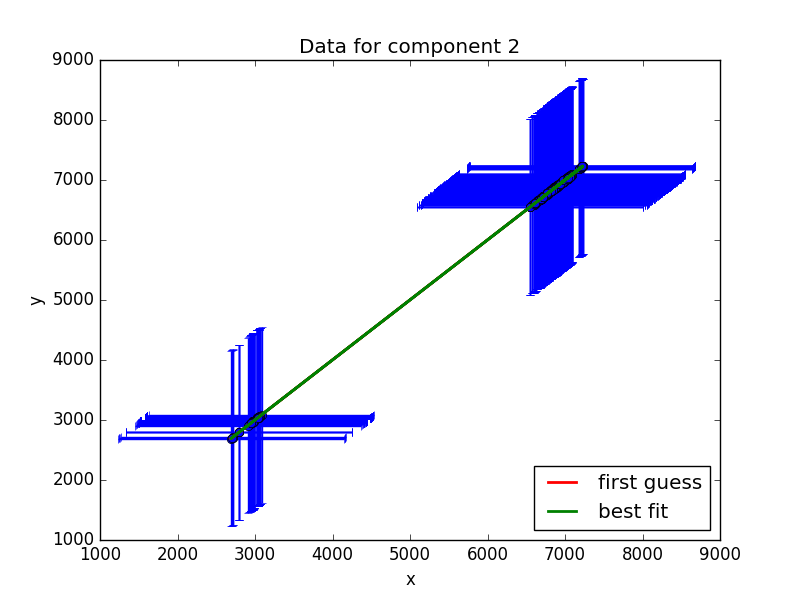
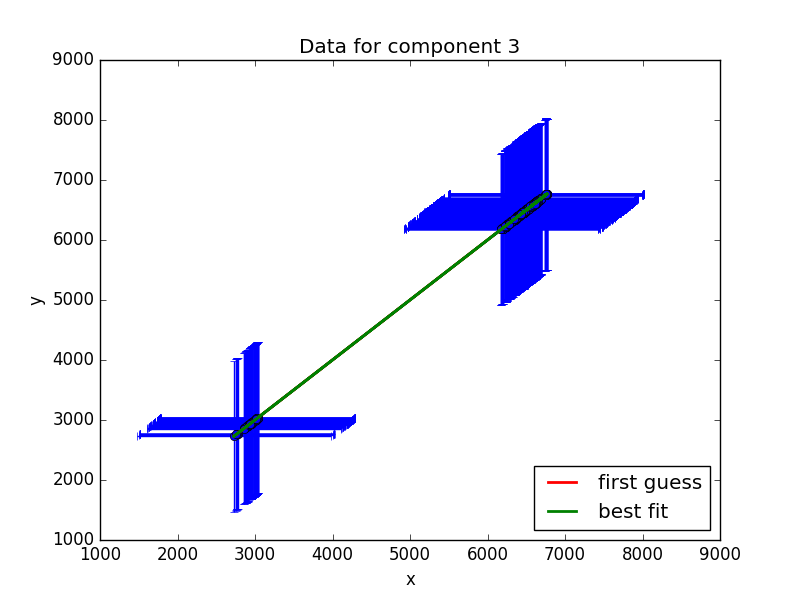
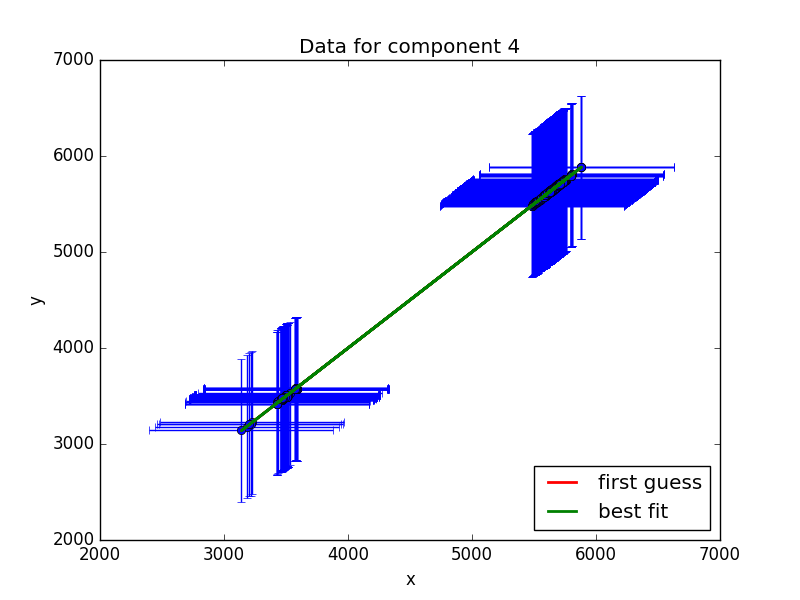
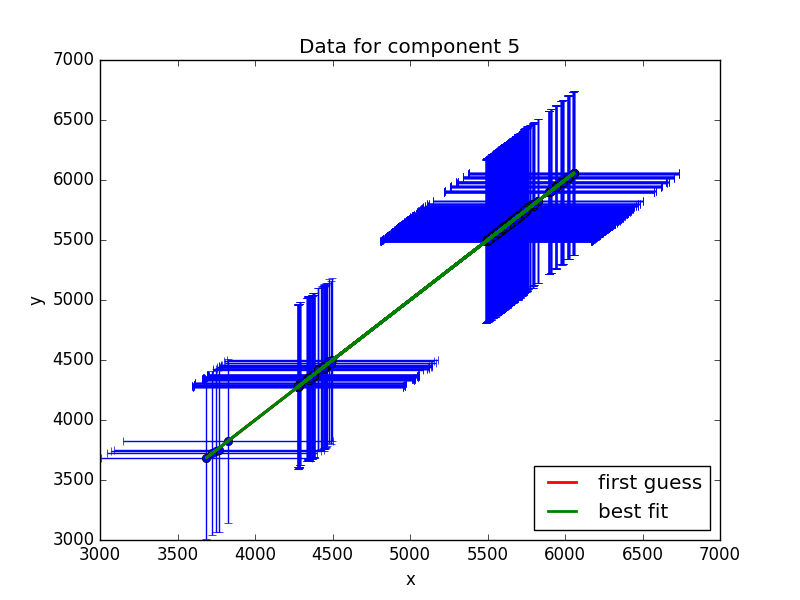
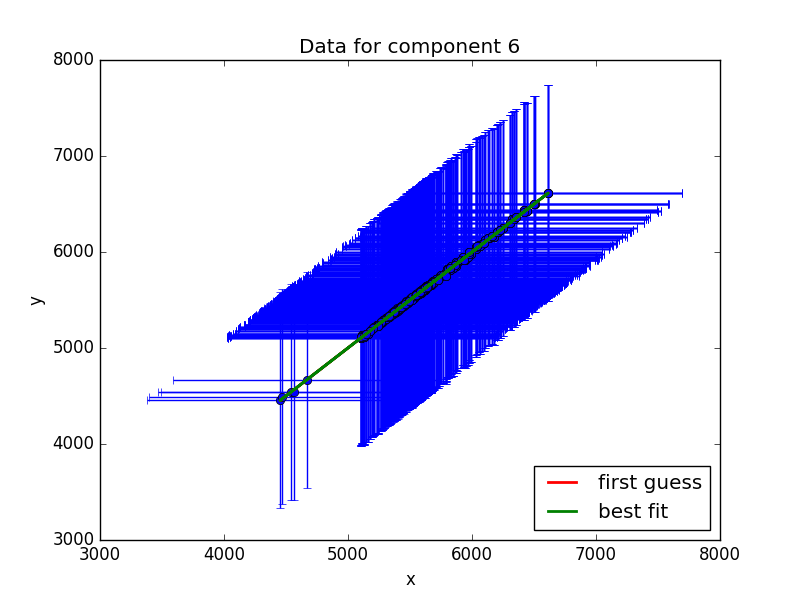
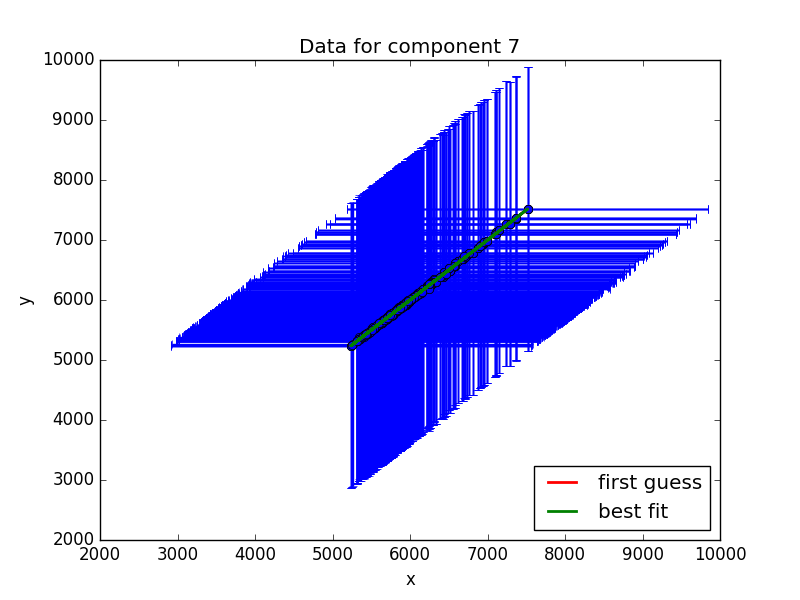
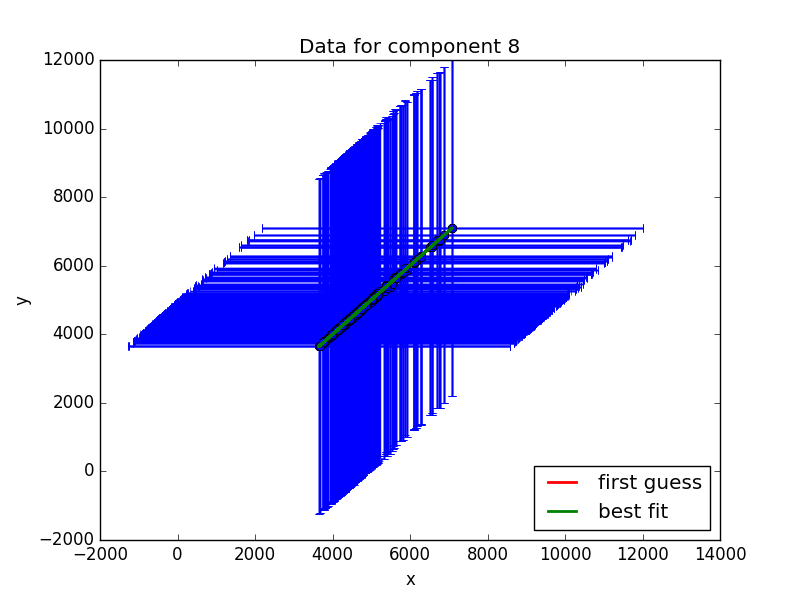
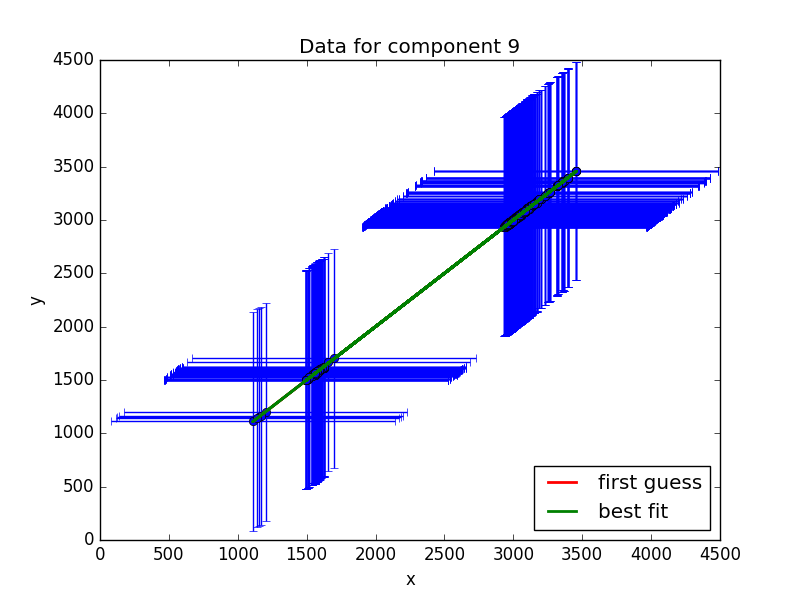
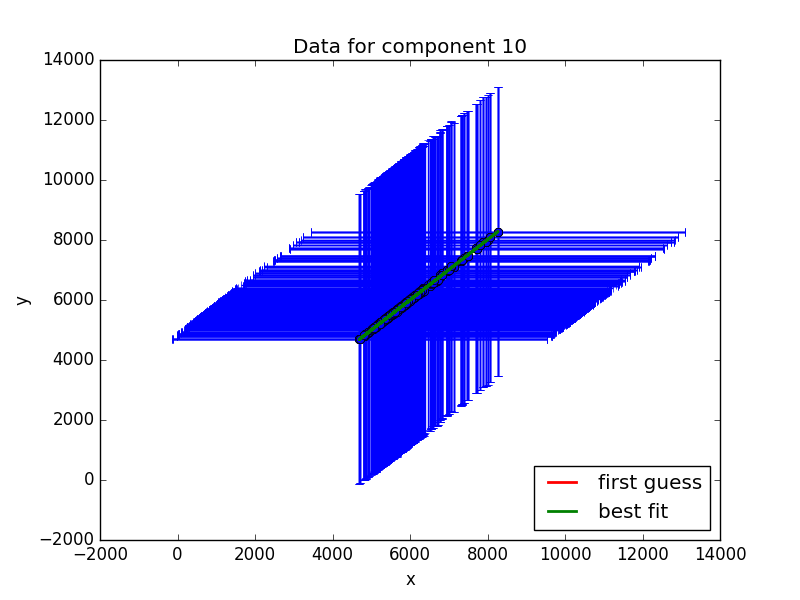
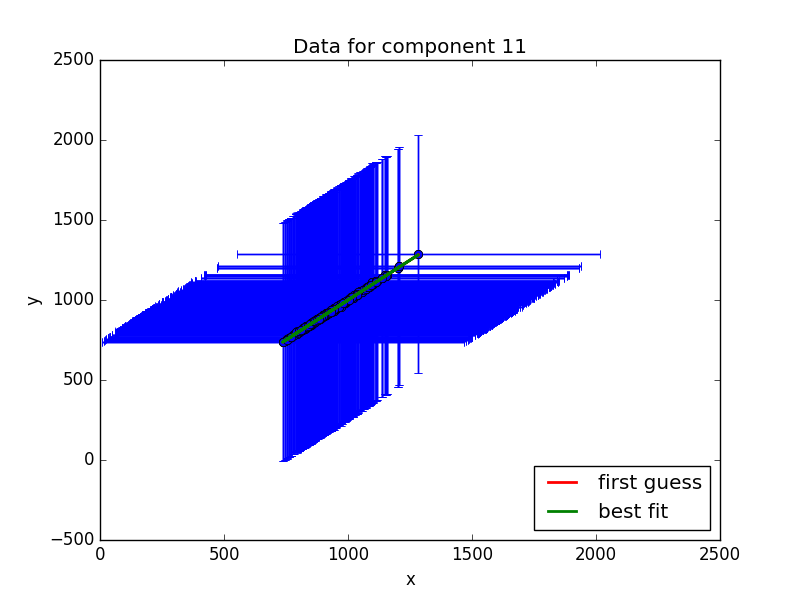
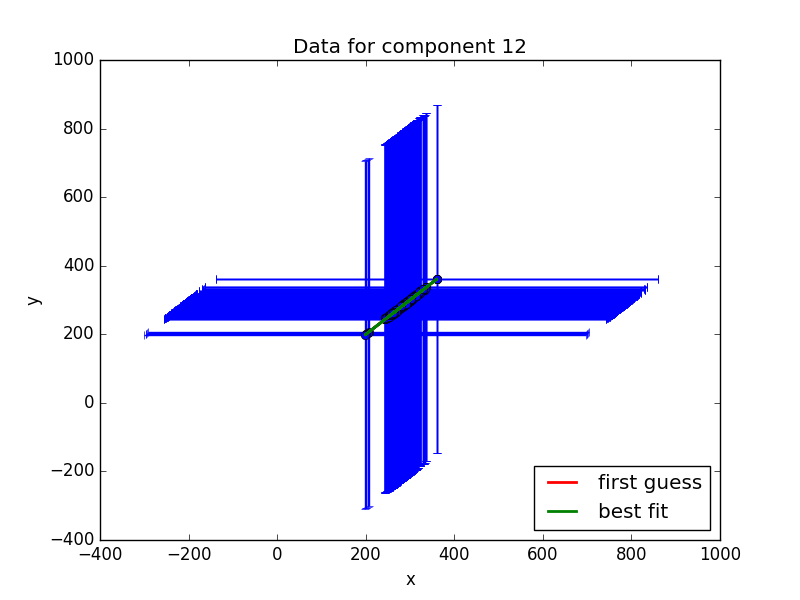
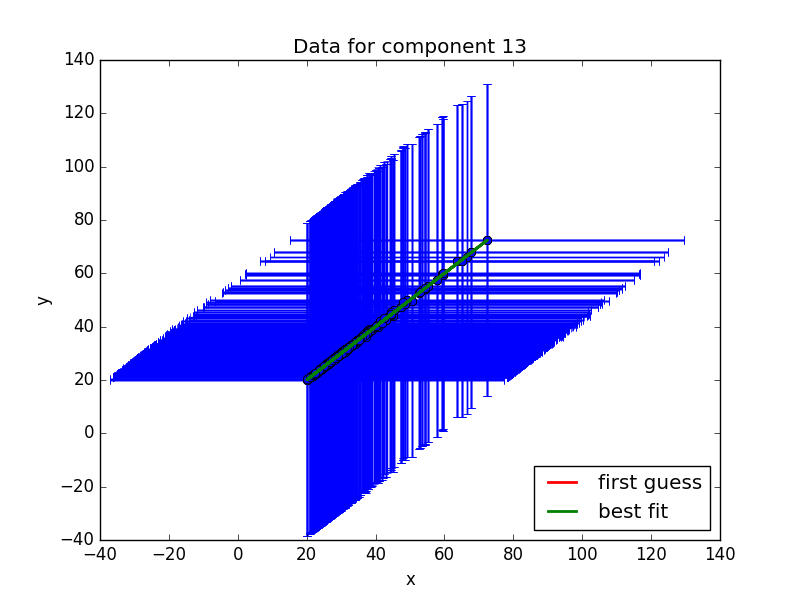
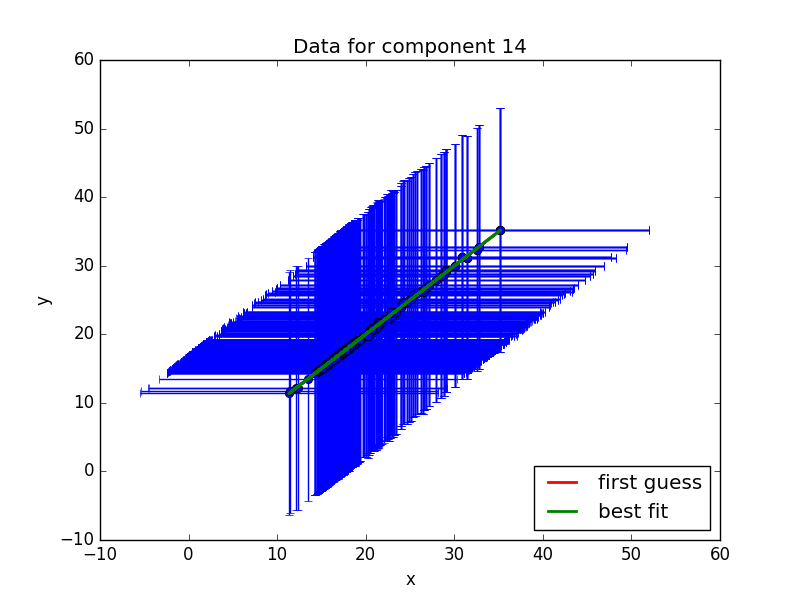
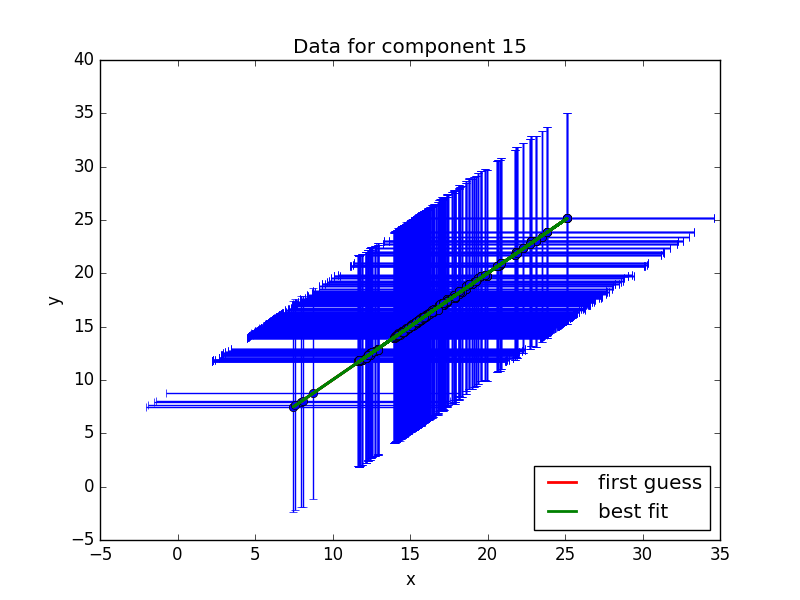
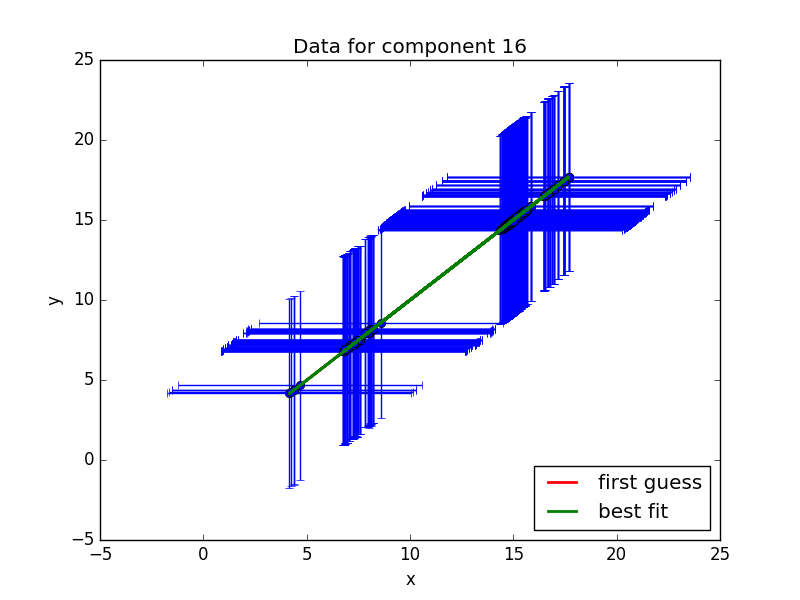
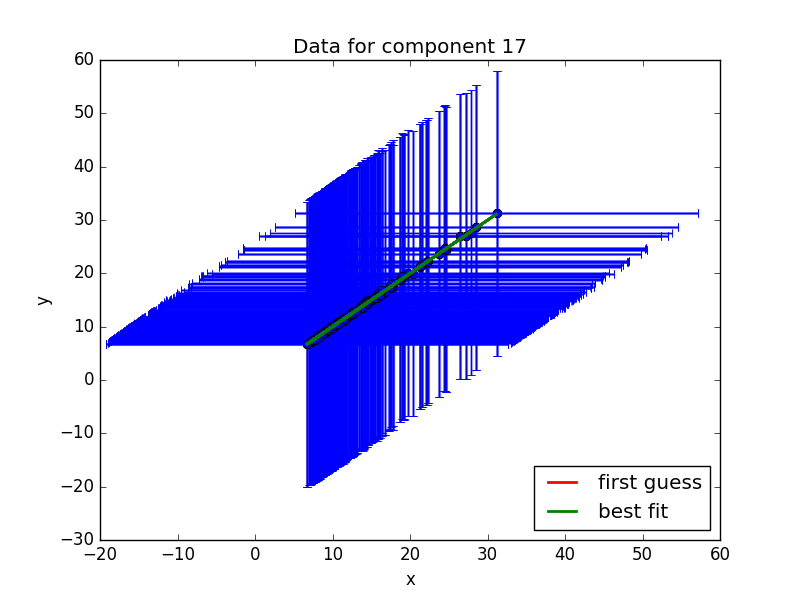
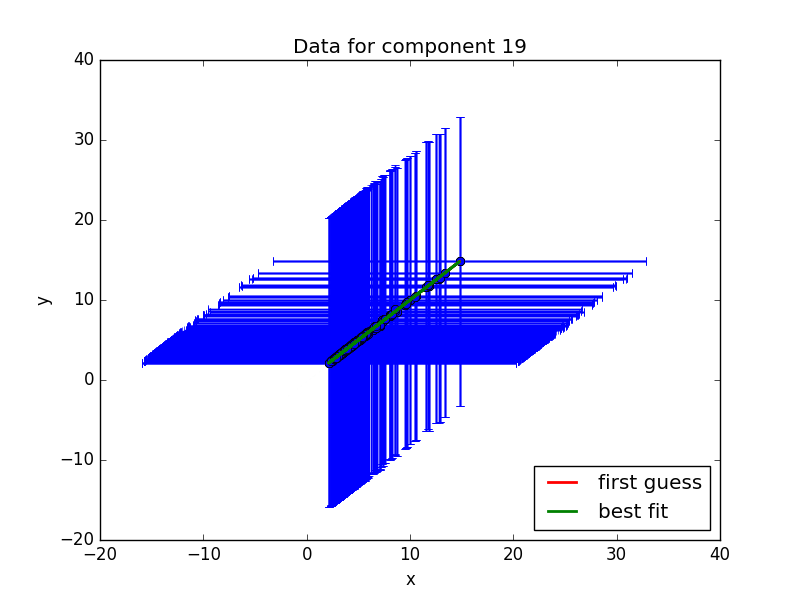
Scatter plots with lines
Final regression values
|
1 |
2 |
3 |
4 |
5 |
6 |
7 |
8 |
9 |
10 |
11 |
12 |
13 |
14 |
15 |
16 |
17 |
18 |
19 |
| m |
1.004211 |
0.999759 |
0.999729 |
1.001058 |
1.000083 |
0.998908 |
0.999857 |
1.004859 |
0.999614 |
1.004781 |
0.996799 |
1.00514 |
0.999672 |
0.997428 |
0.999804 |
1.001638 |
0.997648 |
1.000696 |
1.00106 |
| c |
-10.079726 |
2.760112 |
2.12253 |
-4.8436 |
-1.064754 |
6.40838 |
0.496105 |
-22.775558 |
1.471729 |
-26.991077 |
3.159917 |
-1.405531 |
0.041162 |
0.055183 |
0.011987 |
-0.021541 |
0.035993 |
-0.001714 |
-0.003938 |