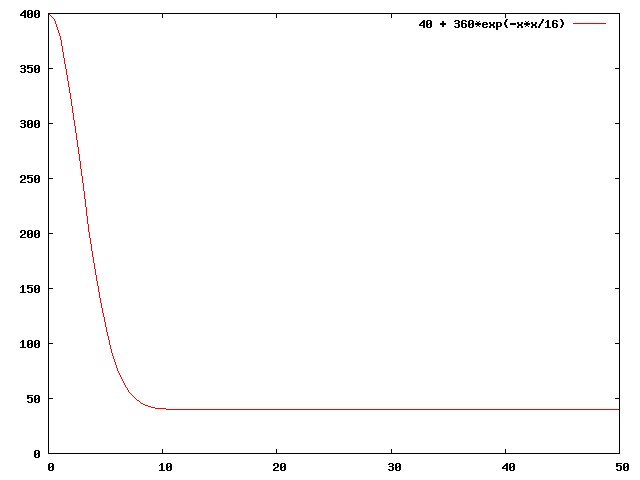
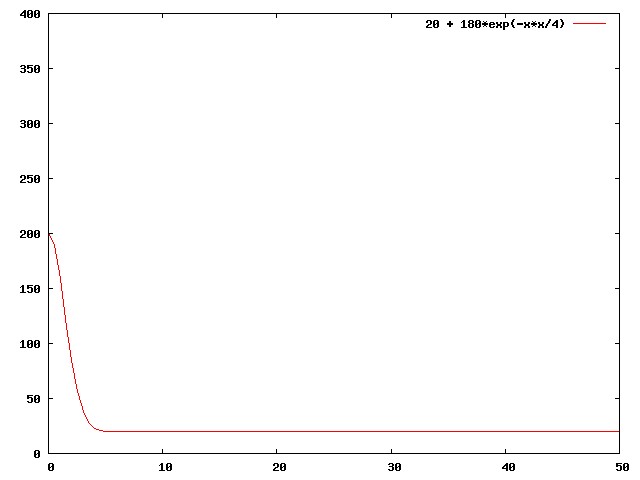
| 1. Data in /export/custard/raid/ross/PVplots_Jul07/SOARonly_400km_40km_d4/ |
| SOAR lengths with vert. mode (km) |
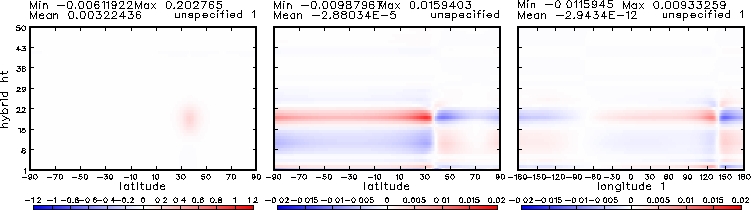
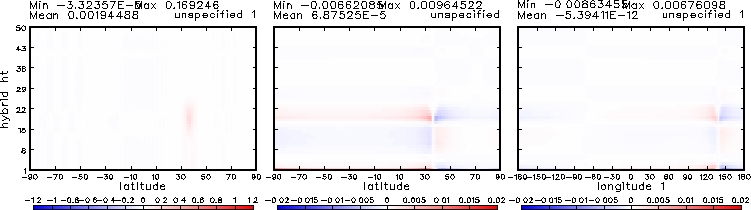
Ubalanced part of analysis increment, cross sections for p, u, v |
 |
 |
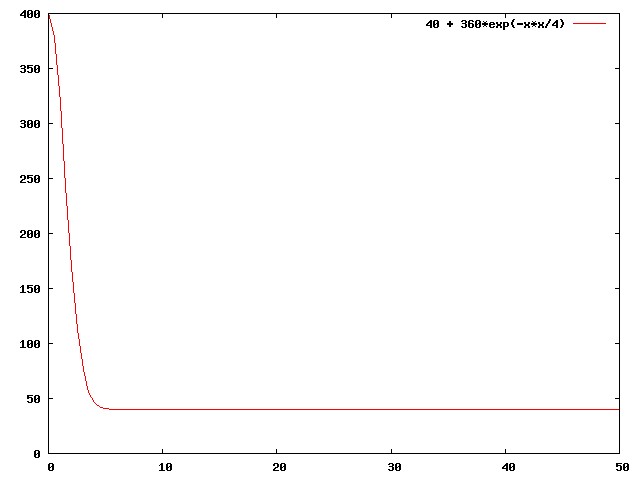
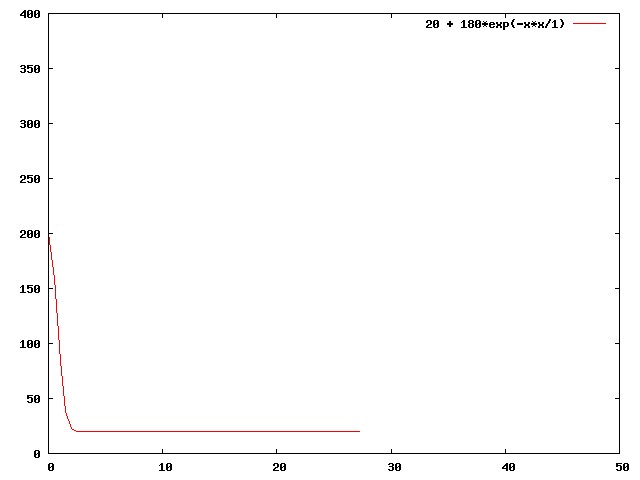
| 2. Data in /export/custard/raid/ross/PVplots_Jul07/SOARonly_400km_40km_d2/ |
| SOAR lengths with vert. mode (km) |
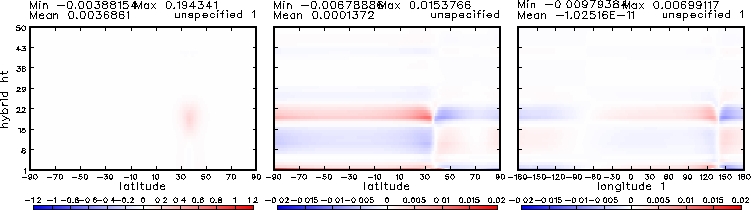
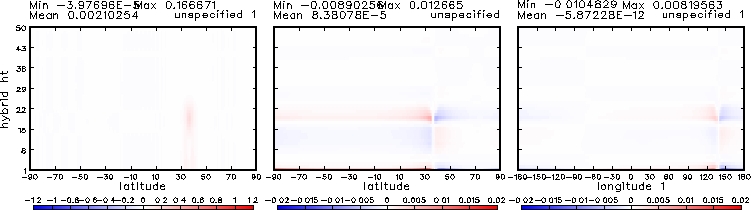
Ubalanced part of analysis increment, cross sections for p, u, v |
 |
 |
| 3. Data in /export/custard/raid/ross/PVplots_Jul07/SOARonly_200km_20km_d2/ |
| SOAR lengths with vert. mode (km) |
Ubalanced part of analysis increment, cross sections for p, u, v |
 |
 |
| 4. Data in /export/custard/raid/ross/PVplots_Jul07/SOARonly_200km_20km_d1/ |
| SOAR lengths with vert. mode (km) |
Ubalanced part of analysis increment, cross sections for p, u, v |
 |
 |
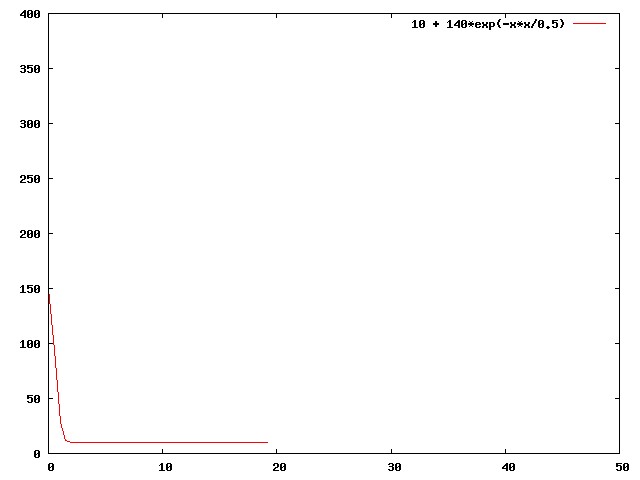
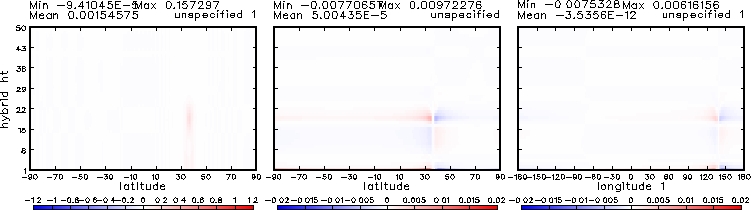
| 5. Data in /export/custard/raid/ross/PVplots_Jul07/SOARonly_150km_10km_d0p7/ |
| SOAR lengths with vert. mode (km) |
Ubalanced part of analysis increment, cross sections for p, u, v |
 |
 |