Pressure Pseudo Observation tests - actual, averaged and pure SOAR spectra


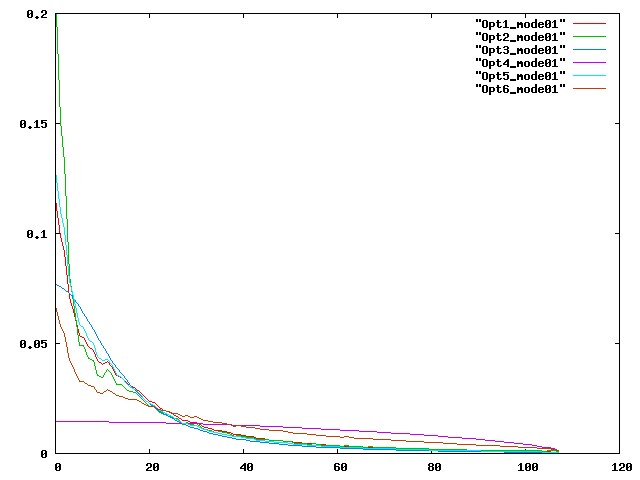
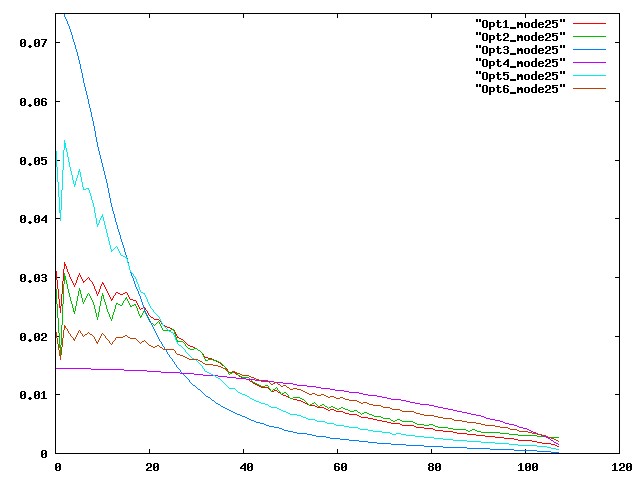
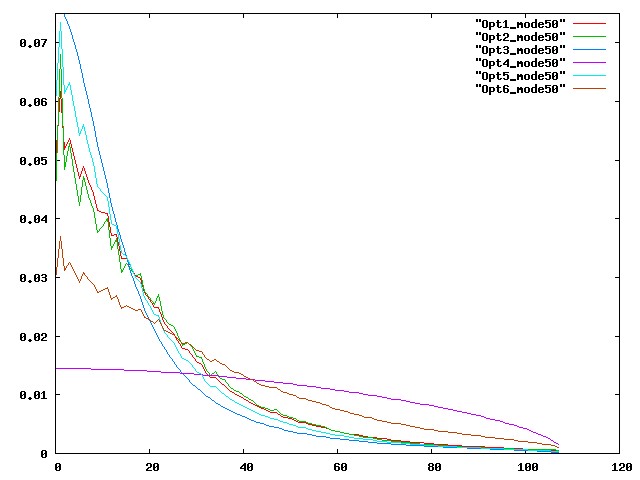
Here, balanced and unbalanced increments of p, u, v are shown from assimilation of pseudo pressure observations. The following variations of horizontal spectra for unbalanced pressure, Ap, are used (other control variables are as default).
  1. SOAR averaged with the actual spectra with SOAR lengthscales set from KE lengthscales (this is the default, hShapeAp(:) = hShape_ConvSOARKECov = 13).
  2. The actual spectra found from the calibration procedure, hShapeAp(:) = hShape_CovFile = 10.
  3. A pure SOAR function, hShapeAp(:) = hShape_SOAR = 1, with SOAR scale 400 km, hScaleAp(:) = 400.0.
  4. A pure SOAR function, hShapeAp(:) = hShape_SOAR = 1, with SOAR scale 40 km, hScaleAp(:) = 40.0.
  5. SOAR averaged with the actual spectra hShapeAp(:) = hShape_ConvSOAR = 15, with SOAR scale 400 km, hScaleAp(:) = 400.0.
  6. SOAR averaged with the actual spectra hShapeAp(:) = hShape_ConvSOAR = 15, with SOAR scale 40 km, hScaleAp(:) = 40.0.
Red is positive, blue is negative
The page ends with plots of the spectra used for a selection of vertical modes.


A.1 Balanced analysis increments from PV scheme using option 1.
below: Pressure, lat/ht, 80 deg W below: Zonal wind, lat/ht, 80 deg W below: Meridional wind, long/ht, 35 deg N


A.2 Balanced analysis increments from PV scheme using option 2.
below: Pressure, lat/ht, 80 deg W below: Zonal wind, lat/ht, 80 deg W below: Meridional wind, long/ht, 35 deg N


A.3 Balanced analysis increments from PV scheme using option 3.
below: Pressure, lat/ht, 80 deg W below: Zonal wind, lat/ht, 80 deg W below: Meridional wind, long/ht, 35 deg N


A.4 Balanced analysis increments from PV scheme using option 4.
below: Pressure, lat/ht, 80 deg W below: Zonal wind, lat/ht, 80 deg W below: Meridional wind, long/ht, 35 deg N


A.5 Balanced analysis increments from PV scheme using option 5.
below: Pressure, lat/ht, 80 deg W below: Zonal wind, lat/ht, 80 deg W below: Meridional wind, long/ht, 35 deg N


A.6 Balanced analysis increments from PV scheme using option 6.
below: Pressure, lat/ht, 80 deg W below: Zonal wind, lat/ht, 80 deg W below: Meridional wind, long/ht, 35 deg N


B.1 Unbalanced analysis increments from PV scheme using option 1.
below: Pressure, lat/ht, 80 deg W below: Zonal wind, lat/ht, 80 deg W below: Meridional wind, long/ht, 35 deg N


B.2 Unbalanced analysis increments from PV scheme using option 2.
below: Pressure, lat/ht, 80 deg W below: Zonal wind, lat/ht, 80 deg W below: Meridional wind, long/ht, 35 deg N


B.3 Unbalanced analysis increments from PV scheme using option 3.
below: Pressure, lat/ht, 80 deg W below: Zonal wind, lat/ht, 80 deg W below: Meridional wind, long/ht, 35 deg N


B.4 Unbalanced analysis increments from PV scheme using option 4.
below: Pressure, lat/ht, 80 deg W below: Zonal wind, lat/ht, 80 deg W below: Meridional wind, long/ht, 35 deg N


B.5 Unbalanced analysis increments from PV scheme using option 5.
below: Pressure, lat/ht, 80 deg W below: Zonal wind, lat/ht, 80 deg W below: Meridional wind, long/ht, 35 deg N


B.6 Unbalanced analysis increments from PV scheme using option 6.
below: Pressure, lat/ht, 80 deg W below: Zonal wind, lat/ht, 80 deg W below: Meridional wind, long/ht, 35 deg N


C. Selection of horizontal spectra using above spectral options.

Mode 1

Mode 25

Mode 50


Data in /export/custard/raid/ross/PVplots_Jul07/.