


Last update
6 Sep 2001

This page is maintained by
Mark Fielding
All content Copyright © The University of Reading unless otherwise stated.
How to interpret cloud radar images
|
If you are puzzled as to what cloud types our real-time cloud radar images correspond to, this page should help. Meteorological radars measure `radar reflectivity factor' which is essentially proportional the size of the particles to the power of six (the scale used in the images below is shown to the right). Hence radar tends to get a much stronger echo from large particles in the atmosphere (such as raindrops and ice crystals) than it does from small particles (such as cloud droplets and dust). We are hoping to supplement the 94 GHz radar images with real-time images from the Chilbolton lidar (like a radar but using light instead of microwaves) in the near future. Because this instrument is sensitive to small rather than large particles, the combination of the two instruments enables the cloud type and composition to be identified much more easily. The images below are all four hour sections. Note that a small signal is always measured in the lowest few pixels because there is leakage between the transmitter and the receiver (a feature common to all radars). | 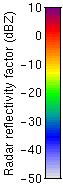 |
 |
Stratocumulus This is the most common cloud type in Britain and is composed entirely of liquid water droplets. Because the droplets are very small (around 10-20 microns in diameter), they tend to give a fairly low radar signal. |
 |
Stratocumulus with drizzle If stratocumulus is more than a few hundred metres thick, then larger `drizzle' drops (around 100-200 microns in diameter) can grow. These give a larger return to the radar, but usually evapourate before they reach the surface. |
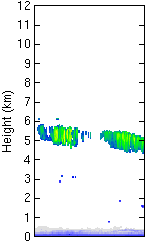 |
Altocumulus This mid-level cloud occurs below freezing and is typically composed of both ice crystals and supercooled liquid water droplets. The radar signal is usually dominated by the larger ice crystals, which tend to be several hundred microns across. |
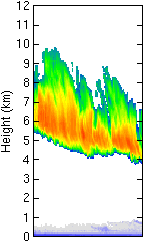 |
Cirrus Cirrus clouds are composed purely of ice crystals and in radar images are characterised by their classic `fallstreak' structure. |
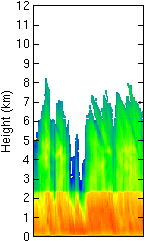 |
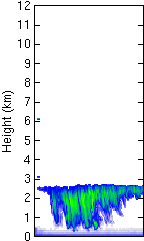
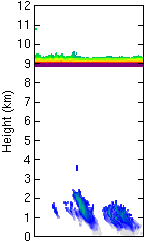
Rain Frontal or `stratiform' rain looks like this. Ice crystals nucleate high in the atmosphere and grow as they fall. At the melting level (2.4 km in this example) the radar reflectivity at increases sharply because the dielectric constant of liquid water is higher than that of ice. The effects of attenuation by rain are also visible as vertical swaths of anomalously cloud-free air above the regions of highest rainfall rate, but this is only really a problem for high-frequency radars such as the 94 GHz Galileo. |
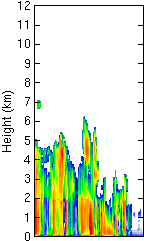 |
Showers When the rainfall is generated by convection the rainfall rate is much more variable. The melting level is visible at 2 km in this example. |
 |
Insects On hot summer days insects are often visible in the lowest 1 or 2 km. They can often be seen carried up from the surface in convective plumes, and in this example have formed a layer at around 800 metres (lidar observations confirmed that no cloud was present on this occasion). In the tropics insects are much more of a problem for cloud radar. |
 |
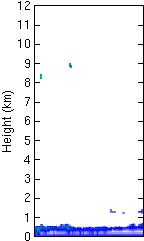
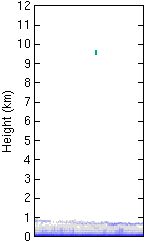
Glitched data You may have spotted occasions when the radar data looked like this - it's not a real cloud at 9 km, but occasionally the radar detector gets out of synch with the transmitter, and the transmit pulse appears at 9 km (as well as cirrus echos `folding' and appearing at low levels). We are hoping to move to a new data acquisition system in the next few months which should cure this problem. |