


Last update
28 Apr 2010

This page is maintained by
Mark Fielding
All content Copyright © The University of Reading unless otherwise stated.
Chilbolton lidars capture the moment when volcanic ash "touched down" in southern England
If it were not for the media coverage, someone looking up into the beautiful blue sky on Friday 16th April 2010 would have had no inkling that a layer of volcanic ash was passing overhead. Yet that afternoon, the first plume of ash from Iceland had made its way to southern England, and "touched down" at the surface at around 3 pm GMT (4 pm local time).
This event was captured in exquisite detail by the lidar instruments that operate around the clock at the Chilbolton Observatory in Hampshire. These instruments send short pulses of light vertically up into the sky, which are reflected back by atmospheric particles. By measuring the time for the light to return, and its intensity, they measure the height and properties of layers of aerosol particles and cloud droplets.
The first picture below shows the intensity of the reflected light from the HALO Photonics near-infrared lidar between 9 am and 9 pm GMT on 16th April. The blue colours in the lower part of the picture demarcate the atmospheric "boundary layer", where turbulent motions lift aerosol particles up to a height of around 1 km. Much more unusual is the thin layer of volcanic ash first seen at 12.30 at a height of 2.5 km, which appears to descend with time. Satellite imagery showed a band of dust around 50 km wide moving southward at around 20 km/hour, explaining why the layer was seen over Chilbolton for around two and a half hours.
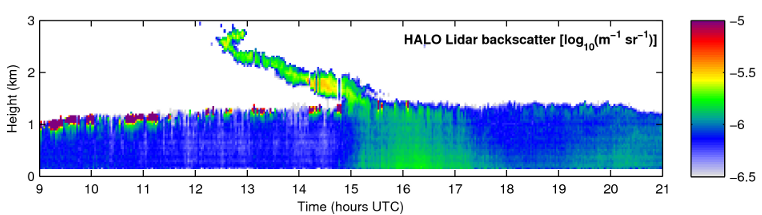
At 3 pm the lidar observed the layer to reach the top of the boundary layer, when it was dramatically mixed downwards to the surface by the turbulent motions in the boundary layer. The higher concentrations of aerosol particles are shown by the green colour. At around this time, several monitoring stations in the south of England reported a spike in sulphur dioxide, a gas known to be emitted by volcanoes. Work is ongoing to confirm whether this was due to the volcano or local sources.
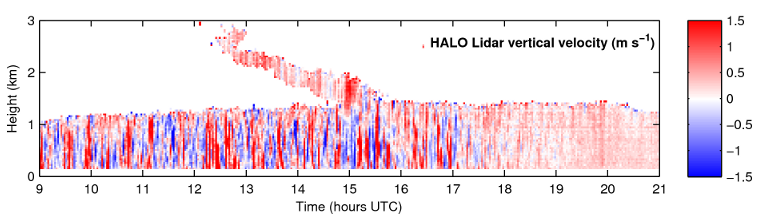
Using the Doppler frequency shift of the returned light to infer the vertical speed of the air, the HALO lidar was able to map out the turbulent motions responsible for the mixing. The middle picture shows rapid fluctuations of vertical wind speed of up to 2 metres per second in the boundary layer, leading to the ash being brought down to the surface within 10 minutes of entering the layer at the top.
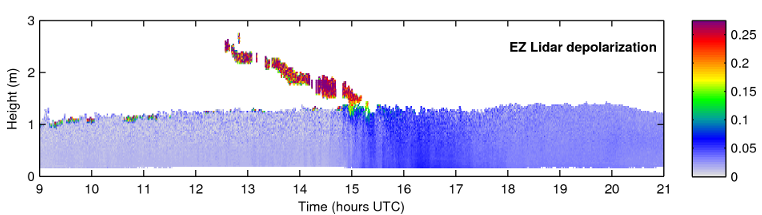
So how can we be sure that these particles are of volcanic origin? Evidence is provided by the depolarization signal from our Leosphere ultraviolet lidar, which can distinguish between spherical and irregular particles. Ordinary aerosol particles over the UK are composed of soluble material such as sulphates and nitrates, which form tiny droplets typically less than 1 micron in diameter. These spherical particles do not depolarize the light and are responsible for the blue-grey colour in the lowest 1 km of the third picture above. By contrast, volcanic ash particles are insoluble and very irregular in shape, resulting in a high depolarization and the red colours in the picture. When these two types of particle are mixed together, we get the blue colour observed between 3 and 5 pm.
By combining the signals from the near-infrared and the ultraviolet lidar, we have been able to estimate the average diameter of the ash particles to be between 1.5 and 2 microns. These observations demonstrate that lidar is an excellent instrument for identifying the location and properties of volcanic ash. If deployed appropriately in future, a network of these instruments could provide real-time information for aviation on the heights and times that it is safe to fly.
Further information: