The 21st November 2000 frontal system.
Damian Wilson
This report details radar and aircraft observations, and model
predictions of
a frontal system which crossed southern England. The leading parts of
the
front were characterized by very uniform precipitation - it would appear
that
no convection was occurring. Towards the rear of the system there was
more
convection and the system ended with a significant amount of supercooled
mid
level cloud. It is instructive to see whether these features can be
picked out by the model. The uniform nature of the system makes it an
ideal
opportunity to try qualitative verification of the water contents
produced
by the model.
Observational Data
Radar
data,
from the Chilbolton radar, for this event can be found via the
University of
Reading
Radar Group website.
Aircraft data should follow soon.
Note the extreme uniformity of the initial scans. There are no regions
of
enhanced differential reflectivity (ZDR), which suggests that there is
little
liquid water present. Later, a plume of high Z appears, which is
associated
with embedded convection, and some supercooled liquid water, although
the
animation suggests that this plume is dominated by material falling into
it
from above. The altostratus at the rear of the front can be observed to
contain large amounts of supercooled liquid from the high ZDR values
produced
by the rapidly growing eccentric crystals. This region appears to have
some indication of convective cells present, though restricted in
vertical
extent.
Model simulation
Click here for postscript version
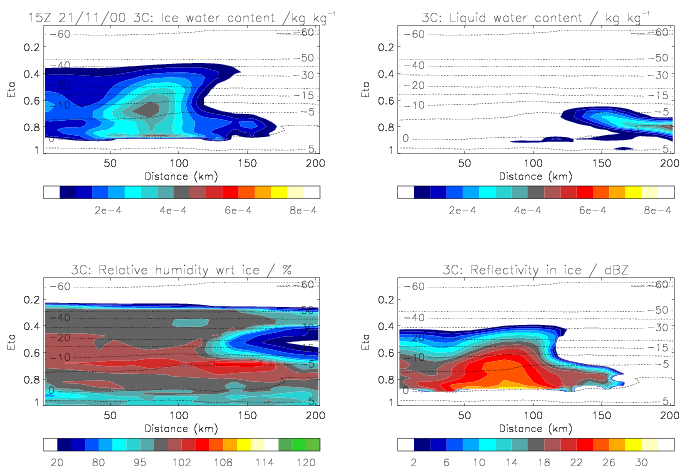
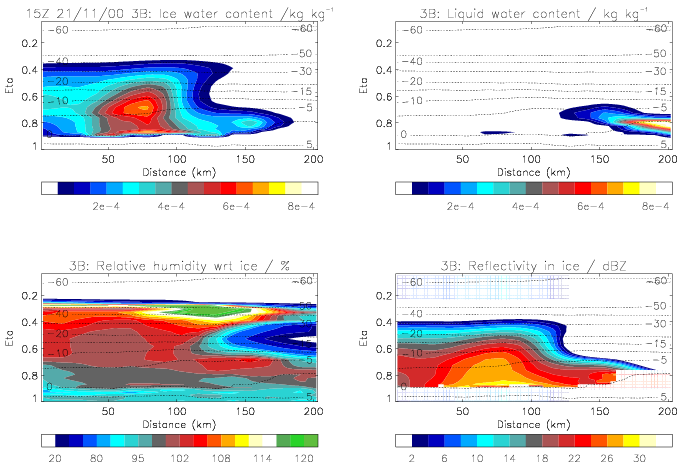
Cross sections of ice content, liquid content, relative humidity
(with respect to ice), temperature and reflectivity are shown. Both
the 3B and 3C precipitation schemes have been used. The cross
sections start at the site of the Chilbolton radar and are on a
bearing of 259 degrees. The model cross-sections are valid at 15Z
from a 6Z (T+9) forecast.
- Model data has been obtained for the equivalent azimuthal cross
section.
It shows, as model data always does, a fairly uniform structure within
the
front. Note that the front is a little late in the model simulation, so
should
be compared with earlier radar scans. The only convection predicted by
the
convection scheme is high up,
near cloud top. The two precipitation schemes tested, the 3B and 3C
schemes,
give different ice water contents. Hopefully this can be validated from
the
aircraft data. Both schemes predict very little liquid water.
-
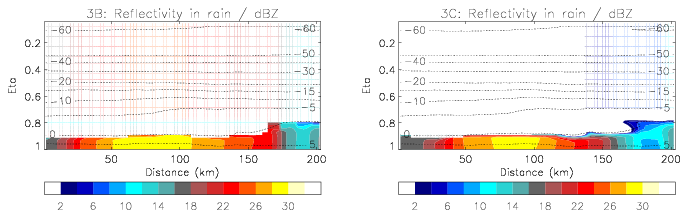
The reflectivities in the rain agree well with the observations, with a
preference to the slightly lower values of the 3C scheme. The
reflectivities
in the ice also agree quite well, again, the lower values of the 3C
scheme
being slightly more preferred. Note that the observations within the main
part of the front contain fairly uniform reflectivity above the melting
layer for about 2 kilometres, before a sharp drop - there is some
indication
of this in the model. Contrast this with the rapid drop in reflectivity
above the melting layer at the back of the front - not picked out in the
models. This must be associated with intense low level growth, which
the model
fails to reproduce so well.
-
Liquid water content is very dependent upon the strength of the local
updraught
(a stronger updraught gives more liquid) and the amount of ice falling
into
the liquid from above). The ice content is also linked to the local
updraught,
but it is also strongly linked to fall-out and advection (also
differential
advection and fall out together), so the history of the system is
important
as well.
-
The model correctly suggests the supercooled liquid water at the rear of
the
front, although it is not picked up as a layer but more as a block.
However,
there is a drier layer between the liquid water and the 0 deg C
isotherm, so
the model is attempting to confine the liquid into a limited vertical
extent,
despite the lack of vertical resolution. The ice content here is much
reduced
compared to the ice content within the main block of the front, yet the
radar
sees similar reflectivities. This would be consistent with the larger
ice
particles grown at the relatively high temperatures and
supersaturations.
-
Analysis of the model vertical
velocities suggests that this region
will ice up fairly rapidly in the near future, and is not in an
equilibrium
state. The liquid will probably be replaced by new liquid cloud further
back in
the front, so retarding the westerly movement of the precipitation.
-
>From the model vertical velocities from this case and the 30th March
case
I might hypothesize that the observed embedded convection may be
linked to strong area-averaged vertical velocities at low levels (just
above the melting
layer) rather than at more intermediate altitudes. These may be capped
by
reduced vertical velocities. could we test this hypothesis using other
data?
Overall, the model is able to reproduce the behaviour of the system
well. It
hence should be a good test for more quantitative assessment of the
model's behaviour.