Quadratic Functions and their Graphs |
PPLATO @ | |||||
PPLATO / Basic Mathematics |
||||||
|
1. Introduction
A general quadratic has the form:
y = ax2 + bx + c
where a, b and c are constants and a ≠ 0. The simplest of these is:
y = x2
- when a = 1, b = c = 0.
The following observations can be made about this simplest case:
- Since squaring any number gives a positive number, the values of y are all positive, except when x = 0, in which case y = 0.
- As x increases in size, so does x2, but the increase in value is 'faster' than the increase in x.
- The graph of y = x2 is symmetric about the y-axis (x = 0). For example, if x = 3 the corresponding y value is 32 = 9. If x = −3, then the y-value is (−3)2 = 9. The two x values are equidistant from the y-axis, one to the left and one to the right, but the two y values are the same height above the x-axis.
This is sufficient to sketch the function.
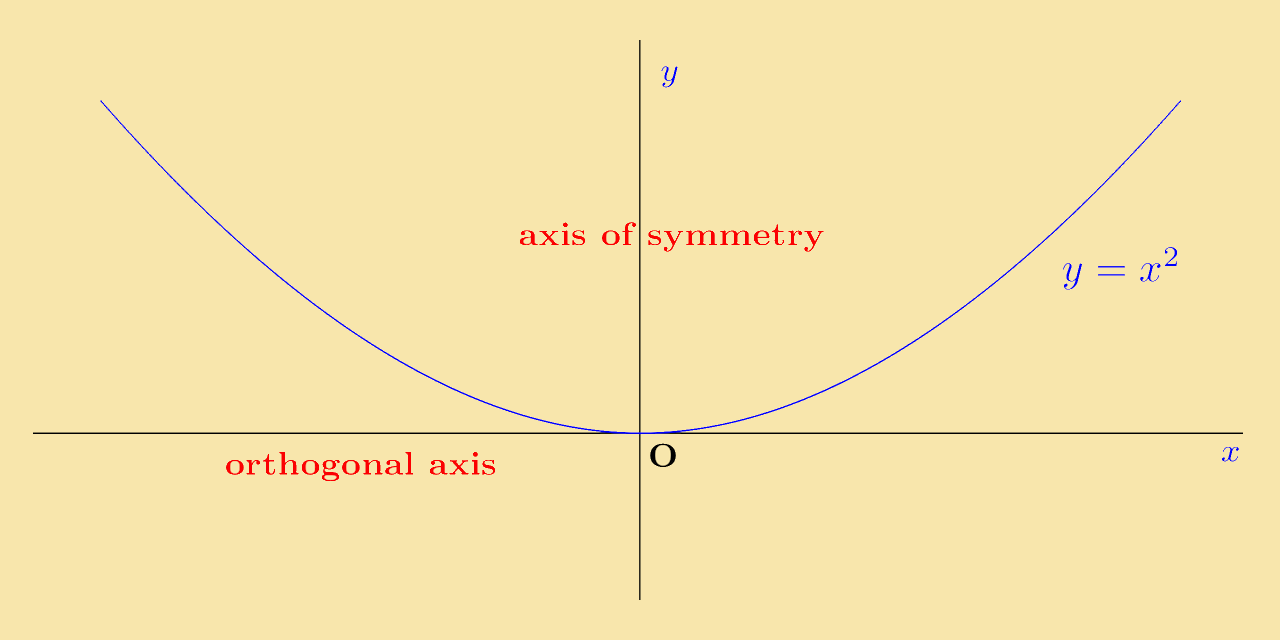
In the graph of y = x2:
- The line x = 0 (i.e. the y-axis) will be called the line of symmetry for this quadratic.
- The line y = 0 (i.e. the x-axis) will be called the orthogonal axis for this quadratic.
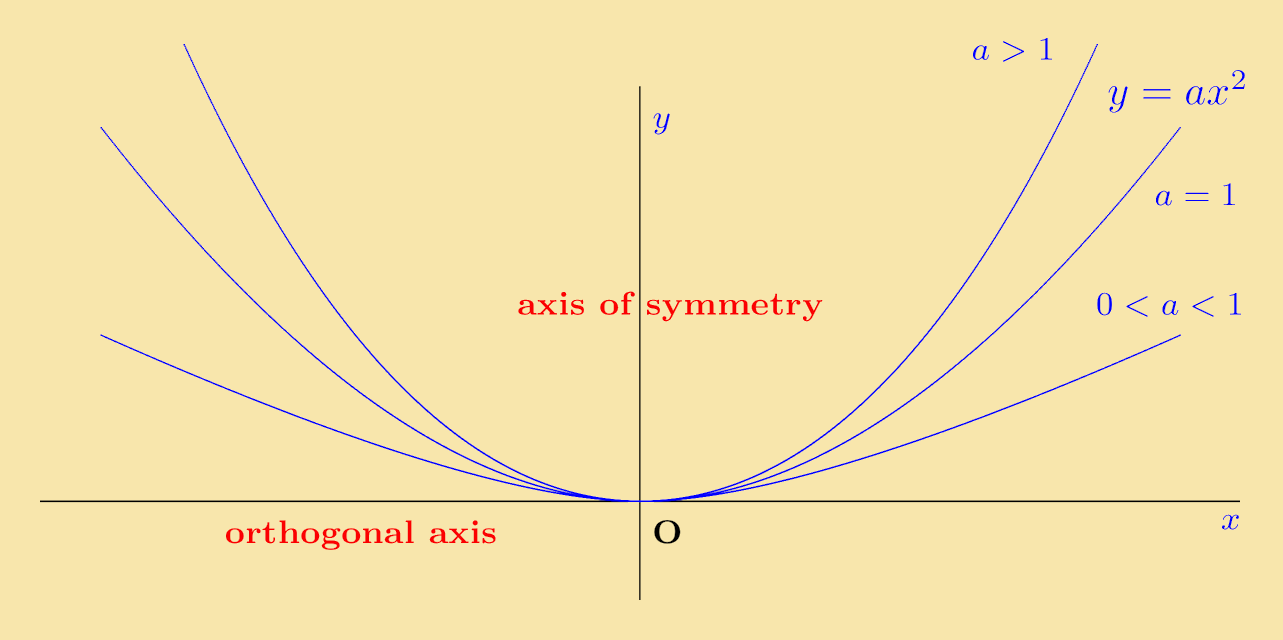
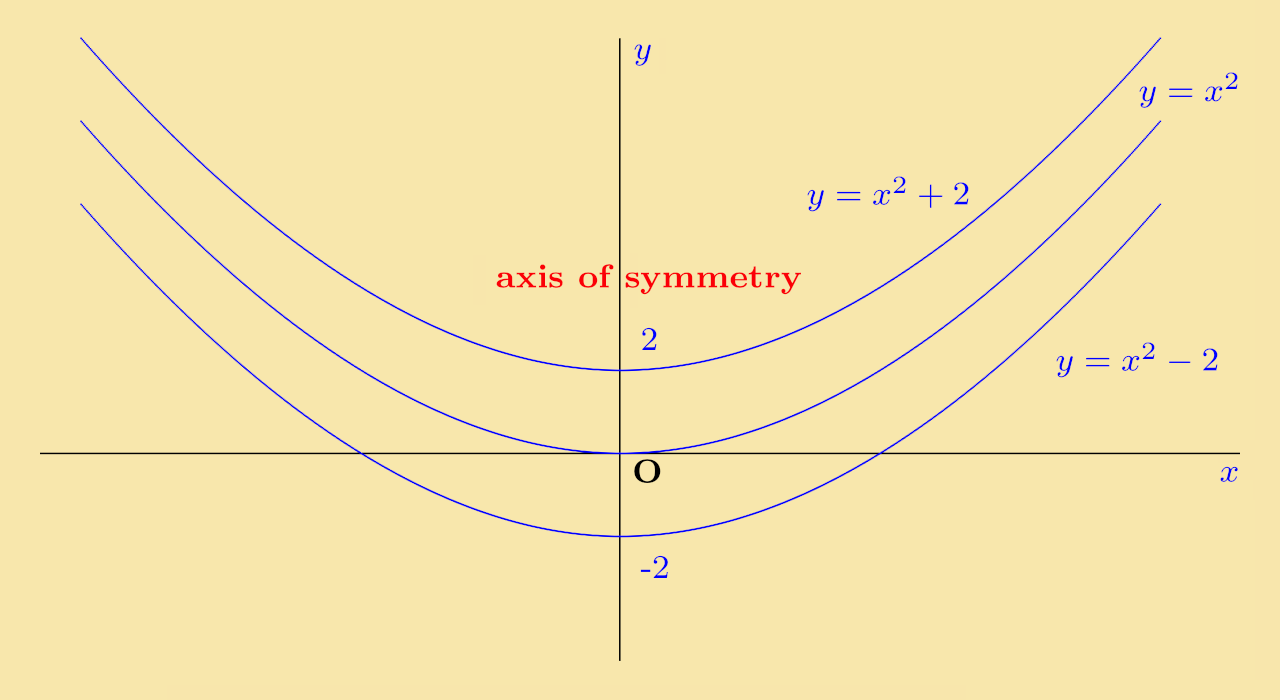
If the equation is, say, y = 2x2, then the graph will look similar to that of y = x2, but will lie above it. For example, when x = 1 the value of x2 is 1, the value of 2x2 is 2. The y value of y = 2x2 is above that for y = x2. Similarly, for the equation y = x2 ⁄ 2, the graph looks similar to that of y = x2 but now lies below it. This is illustrated in the figure below.
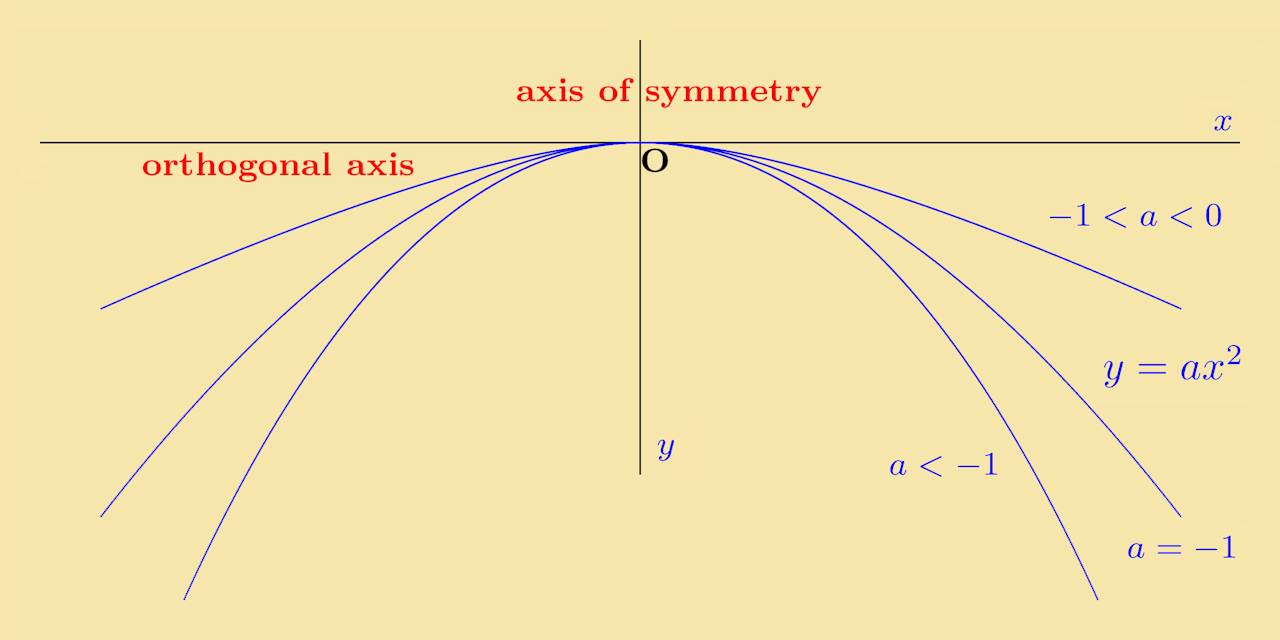
The next possible choice is a = −1, with the equation y = −x2. In this case the graph of the equation will have the same shape but now, instead of being above the x-axis, it is below. When x=1, the corresponding y value is −1. In a similar way, for differing negative values of a the graphs are below the x-axis.
Quiz 1: The figure below shows a sketch of three quadratics. What can be determined about a, b and c?
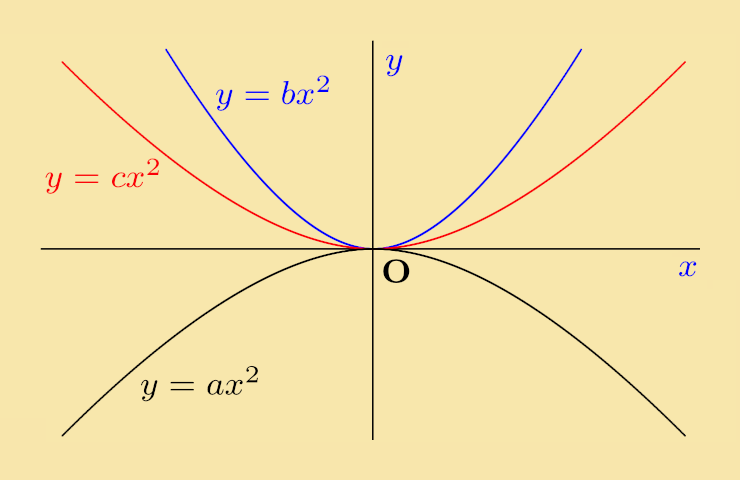
Explanation: The curves for y = bx2 and y = cx2 are both above the x-axis and the former of these is above the latter, so b > c. The curve for y = ax2 is below the x-axis so a < 0. Since every positive number is greater than every negative number, it follows that b > c > a.
2. Graph of y = ax2 + c
This type of quadratic is similar to the basic ones in the Introduction section, but with a constant added, i.e. with the general form:
As a simple example of this take the case y = x2 + 2. Comparing this with the function y = x2, the only difference is the addition of 2 units. As such:
- When x = 1, x2 = 1, but x2 + 2 = 1 + 2 = 3.
- When x = 2, x2 = 4, but x2 + 2 = 4 + 2 = 6.
- These points have been lifted by 2 units.
- This happens for all of the x values, so the shape of the graph is unchanged but gets lifted upwards by 2 units.
Similarly, the graph of y = ax2 − 2 will be lowered by 2 units.
3. Graph of y = a (x − k)2
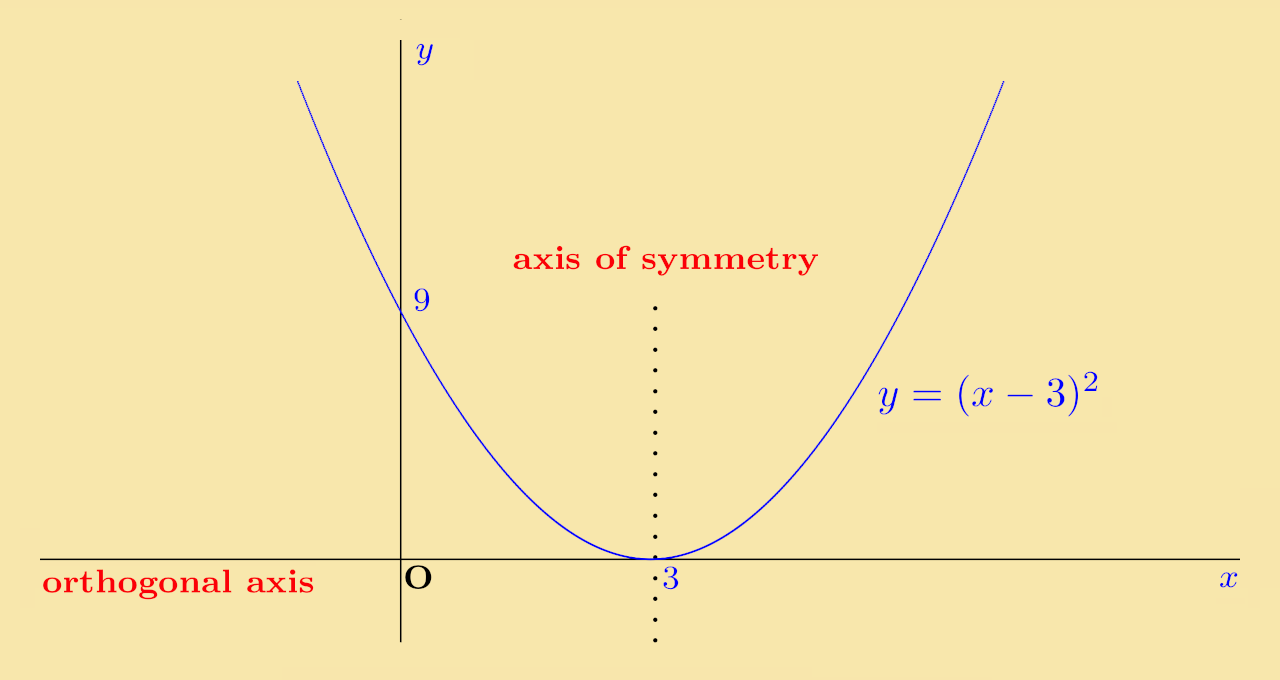
In the examples considered so far, the axis of symmetry is the y-axis, i.e. the line x = 0. The next possibility is a quadratic which has its axis of symmetry not on the y-axis. An example of this is:
which has the same shape and the same orthogonal axis as y = x2 but with the axis of symmetry the line x = 3.
- The points x = 0 and x = 6 are equidistant from 3.
- When x = 0 the y value is (0 − 3)2 = 9
- When x = 6 the y value is (6 − 3)2 = 9
- The points on the curve at these values are both 9 units above the x-axis.
- This is true for all numbers which are equidistant from 3.
The graph y = (x − 3) is illustrated below:
4. Graph of y = a (x − k)2 + m
So far, two separate cases have been discussed: first, a standard quadratic has its orthogonal axis shifted up or down; and second, a standard quadratic has its axis of symmetry shifted left or right. The next step is to consider quadratics that incorporate both shifts.
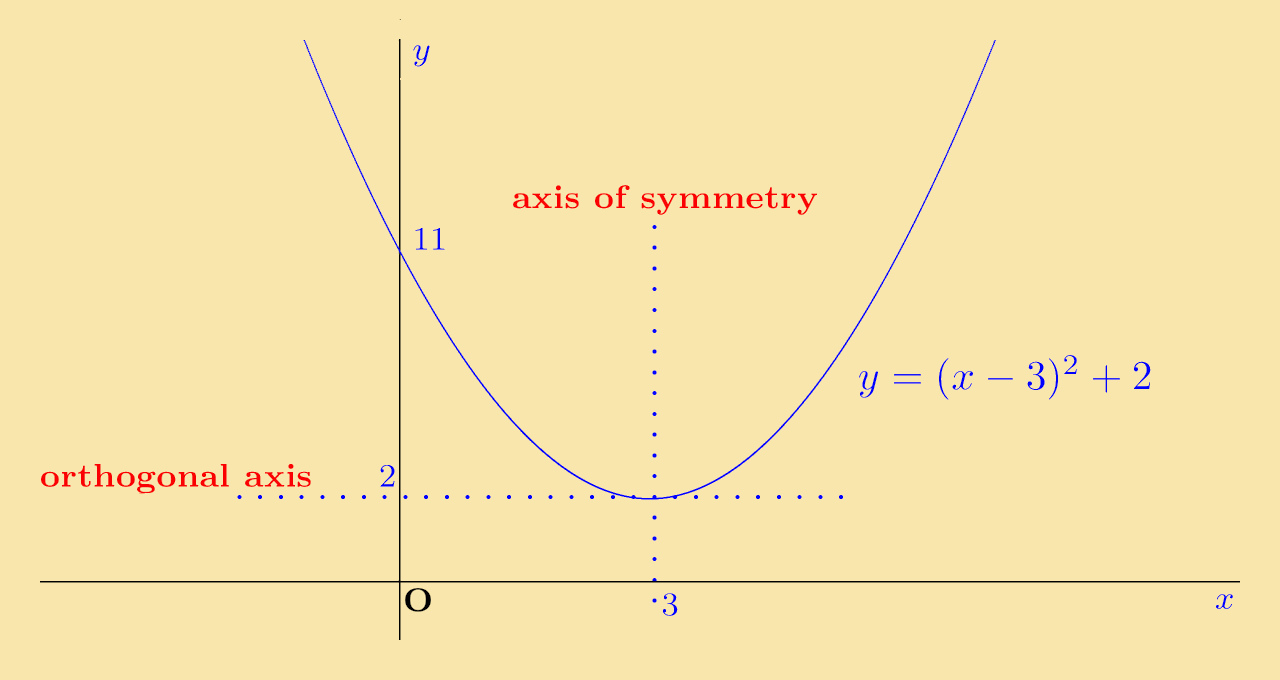
Example 1: The quadratic y = x2 is shifted so that its axis of symmetry is as x = 3 and its orthogonal axis is at y = 2.
Solution: The new curve is symmetric about x = 3 and is shifted up by 2 units, so its equation is y = (x − 3)2 + 2.
Solution: The curve crosses the y-axis when x = 0 . Putting this into the equation y = x2 + 2, the corresponding value of y is y = (0 − 3)2 + 2 = 11, so the curve crosses the y-axis at y = 11.
Solution:
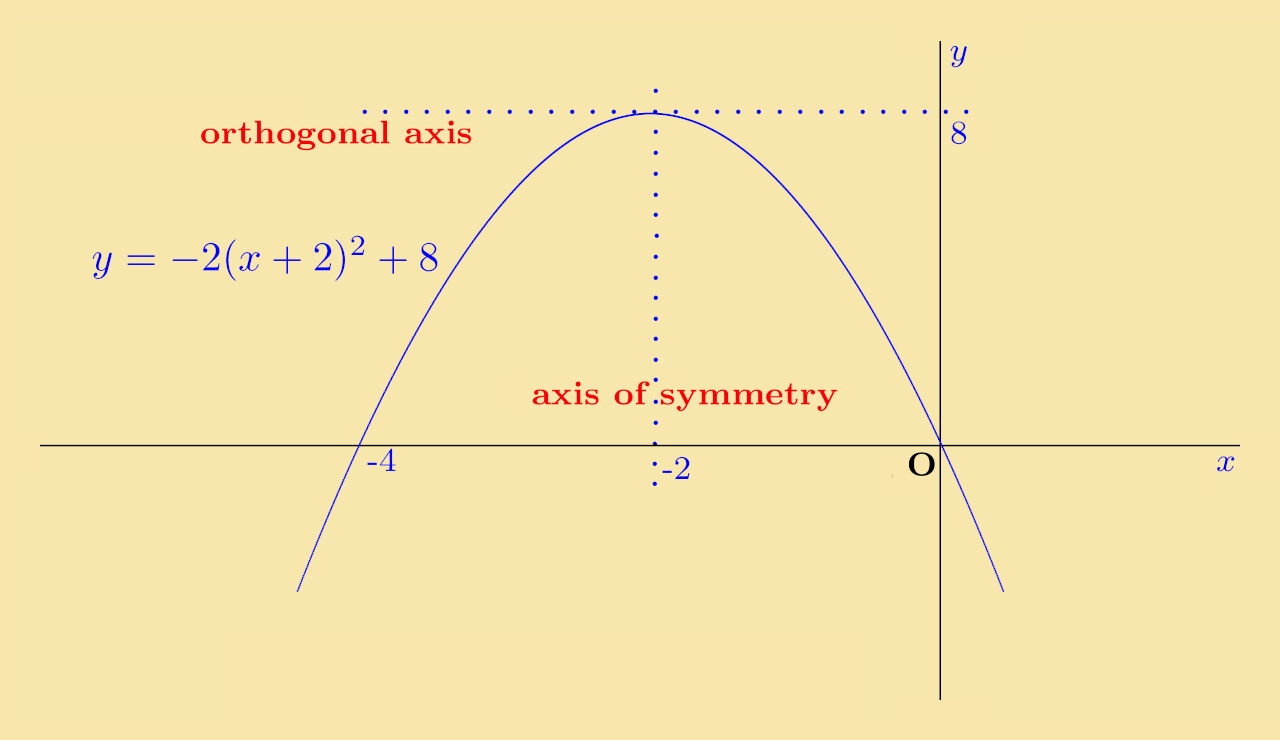
Exercise 1: The curve y = −2x2 is shifted so that its axis of symmetry is the line x = −2 and its orthogonal axis is x = 8.
Solution: The equation is:
Solution: The curve cuts the y-axis when x=0. Putting x = 0 into the equation y = −2(x + 2)2 + 8, the corresponding y value is:
−2 (0 + 2)2 + 8 = −2 (2)2 + 8 = − 8 + 8 = 0, i.e. y = 0.
The curve cuts the x-axis when y = 0. In this case, putting the value y = 0 into the equation y = −2(x + 2)2 + 8 leads to:
| −2 (x + 2)2 + 8 | = | 0 |
| 8 | = | 2 (x + 2)2 |
| (x + 2)2 | = | 4 |
| (x + 2) | = | ±2 |
| x | = | −2 ± 2 |
so there are two solutions, x = −4 and x = 0.
To summarise: the graph cuts the coordinate axes at two points with coordinates (−4, 0) and (0, 0).
Solution: The curve is sketched below:
Click on questions to reveal their solutions
Exercise 2: For the following curves, write down each curve's equation, find the co-ordinates of the points where the curve cuts the x- and y-axes, and sketch the curve.
Solution: The equation of the shifted curve is
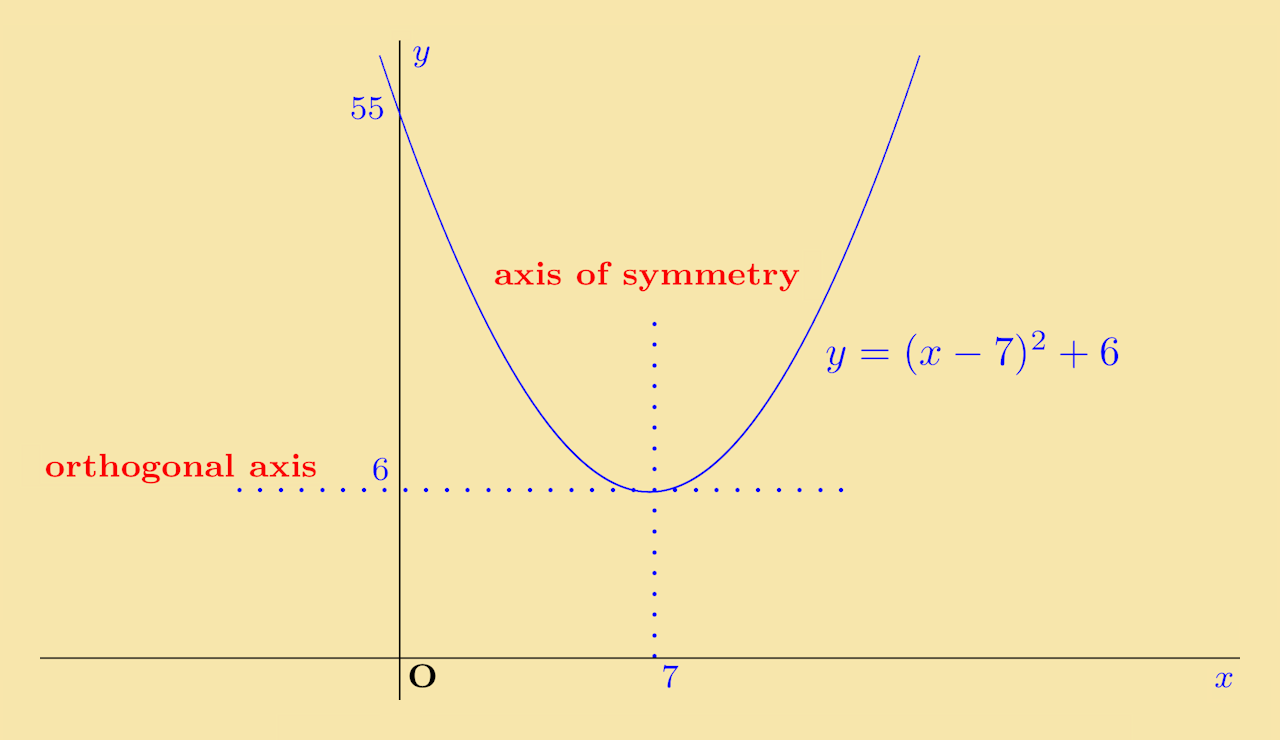
y = (x−7)2 + 6
This will cross the y-axis when x = 0, i.e. when:
It does not cross the x-axis since its lowest point is on the orthoganal axis, which is y = 6. A sketch of the graph is shown below:
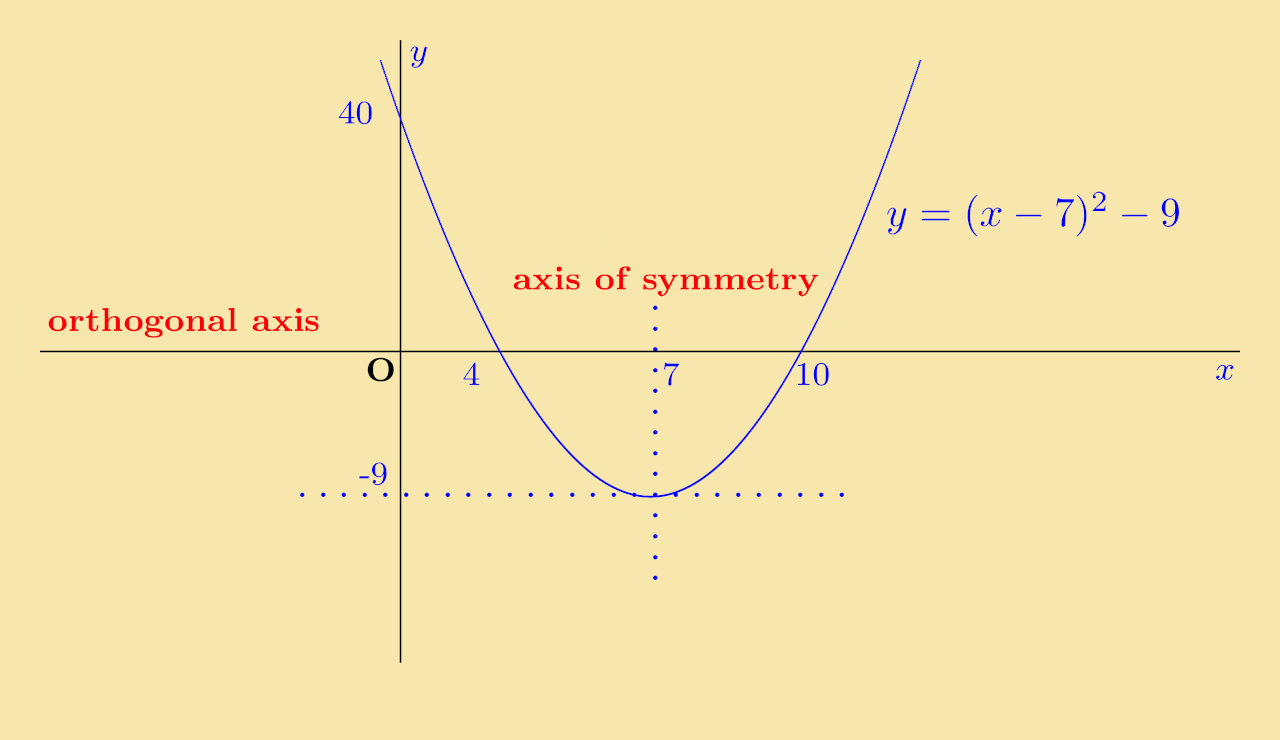
Solution: This curve will have the same shape as that the curve in part (a), but it is now shifted down rather than up. The equation of the curve is:
This will cross the y-axis when x = 0 and y = (0 − 7)2 − 9 = 49 − 9 = 40. It will cross the x-axis when y = 0. Substituting this into the equation gives:
| (x−7)2 − 9 | = | 0 |
| (x−7)2 | = | 9 |
| x − 7 | = | ±3 |
| x | = | 7 ± 3 |
i.e. the curve cuts the x-axis at 4 and 10.
To summarise, the lowest point is on the orthogonal axis at x = 7, y = −9, it crosses the y-axis at y = 40 and it crosses the x-axis at x = 4, x = 10. The curve is sketched below:
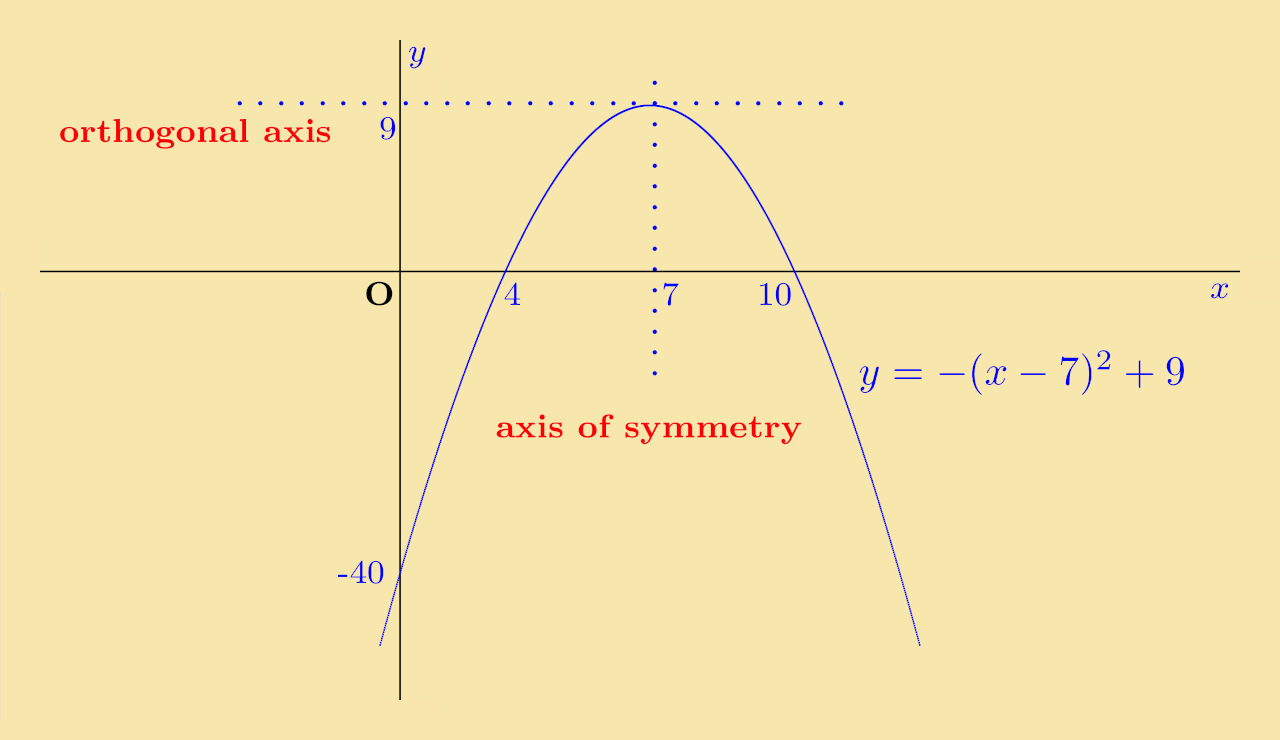
Solution: The equation for this curve is:
This will cross the y-axis when x = 0, i.e. at y = −(0 − 7)2 + 9 = −49 + 9 = −40. It crosses the x-axis when y = 0, i.e.
| −(x − 7)2 + 9 | = | 0 |
| 9 | = | (x − 7)2 |
| x − 7 | = | ±3 |
| x | = | 7 ± 3 |
which gives x = 4 and x = 10.
To summarise, the curve has its highest point when x = 7 and y = 9, which is the orthogonal axis, it crosses the y-axis at y = −40 and it crosses the x-axis at x = 4 and x = 10. A sketch of the curve is shown below:
Click on questions to reveal their solutions
5. Graph of a General Quadratic
This section is about sketching general quadratic functions, i.e. ones of the form
ax2+bx+c
The algebraic expression must be rearranged so that the line of symmetry and the orthogonal axis may be determined. The procedure required is completing the square (see module on Quadratics).
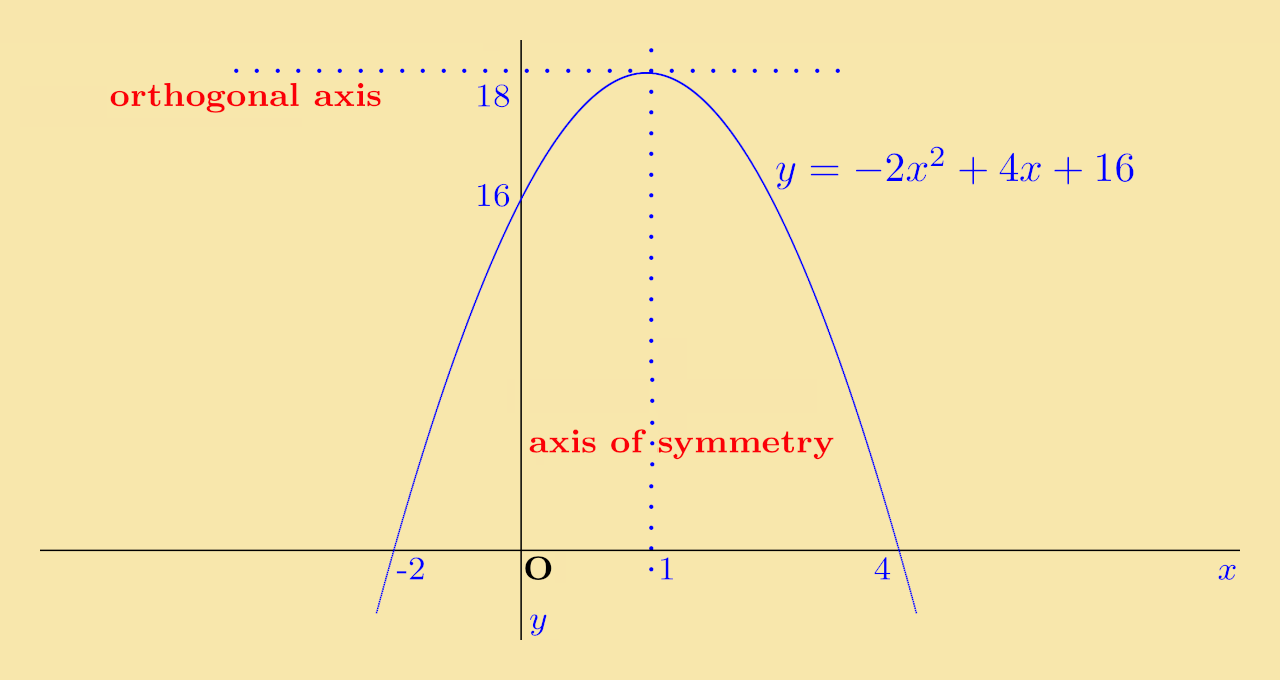
Example 2: A quadratic function is given as −2x2 + 4x + 16.
Solution: Completing the square:
| y = −2x2 + 4x + 16 | = | −2 (x2 − 2x) + 16 |
| = | −2 [(x − 1)2 − 1] + 16 | |
| i.e. y | = | −2 (x − 1)2 + 18 |
Solution: This is the function y = −2x2 moved so that its axis of symmetry is x = 1 and its orthogonal axis is y = 18
Solution: The function is y = −2(x − 1)2 + 18. This will cross the x-axis when y = 0, i.e. when:
| −2 (x−1)2 + 18 | = | 0 |
| 18 | = | 2 (x − 1)2 |
| 9 | = | (x − 1)2 |
| taking square roots, x − 1 | = | ±3 |
| x | = | 1 ± 3 |
| = | 4 or −2 |
Putting x = 0 into the original form of the function y = −2x2 + 4x + 16, this gives y = 16, i.e. it crosses the y-axis at y = 16.
Solution:
Here are some exercises for practice:
Exercise 3: Using the method shown in Example 2, sketch each of the following quadratic equations:
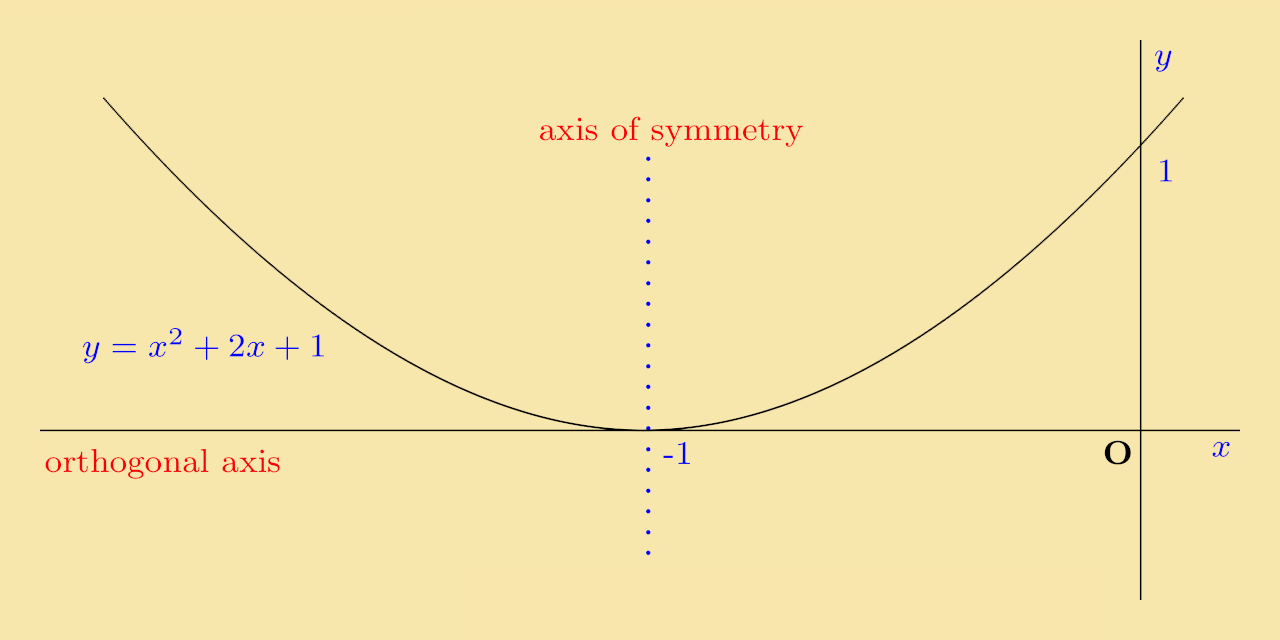
Solution: The equation can be rewritten as y = (x + 1)2. A sketch of the function is shown below:
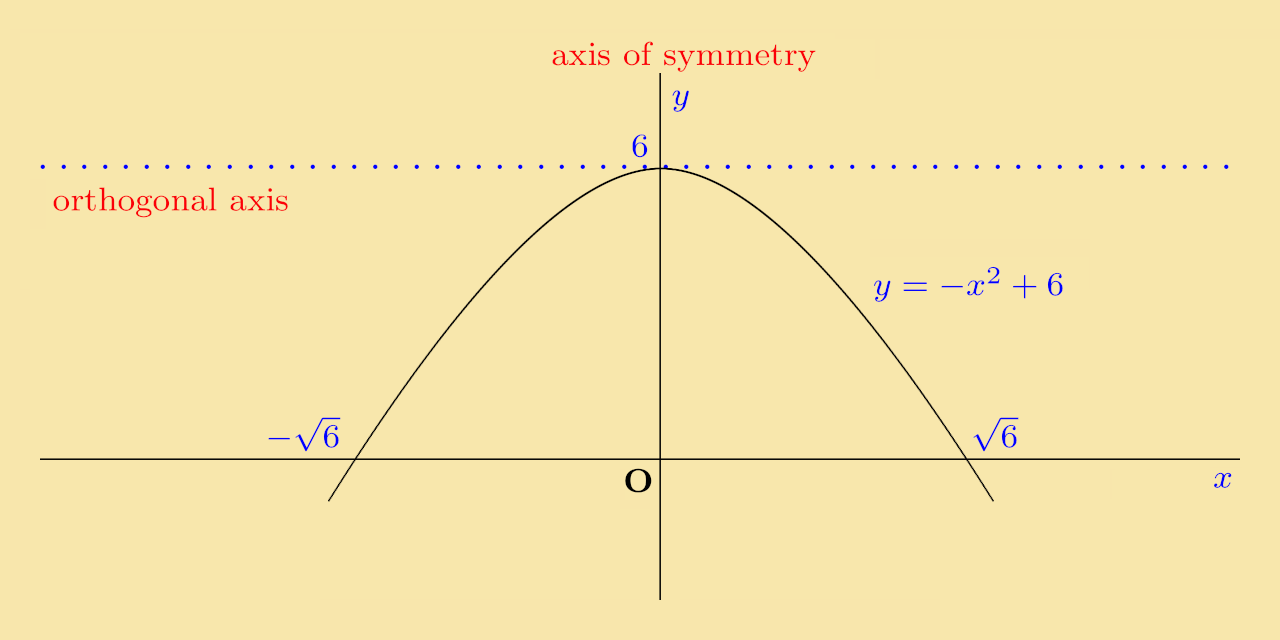
Solution: The function y = 6 − x2 is already a complete square and is sketched below:
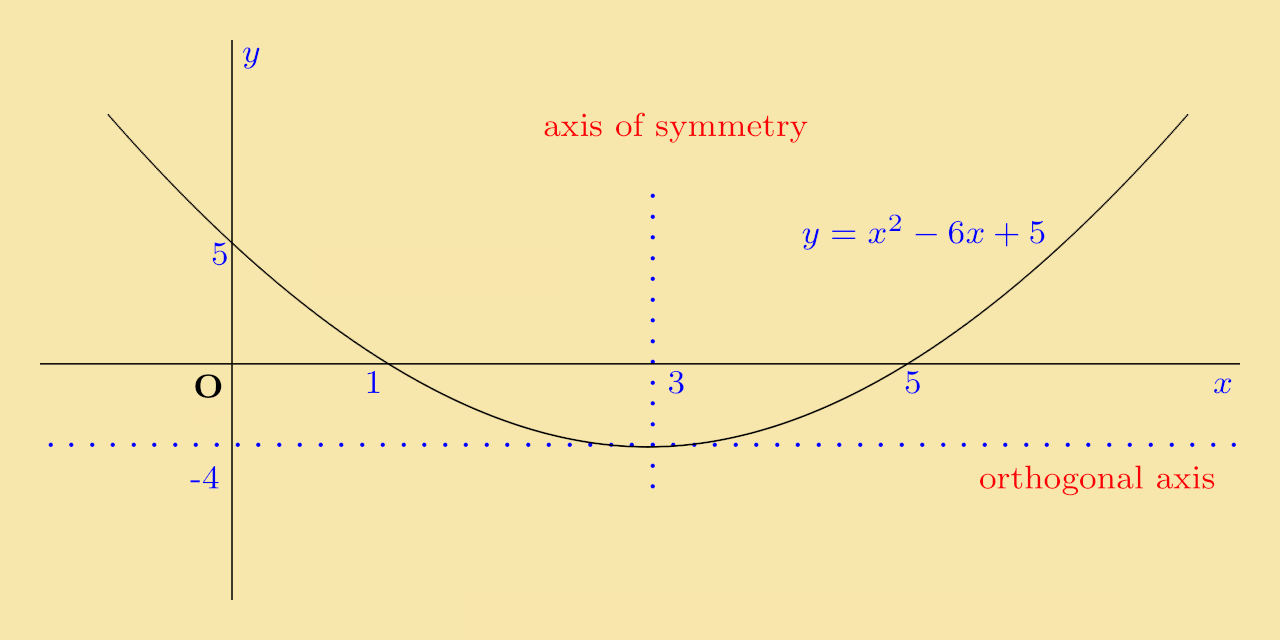
Solution: On completing the square, the original function y = x2 − 6x + 5 becomes y = (x − 3)2 − 4.
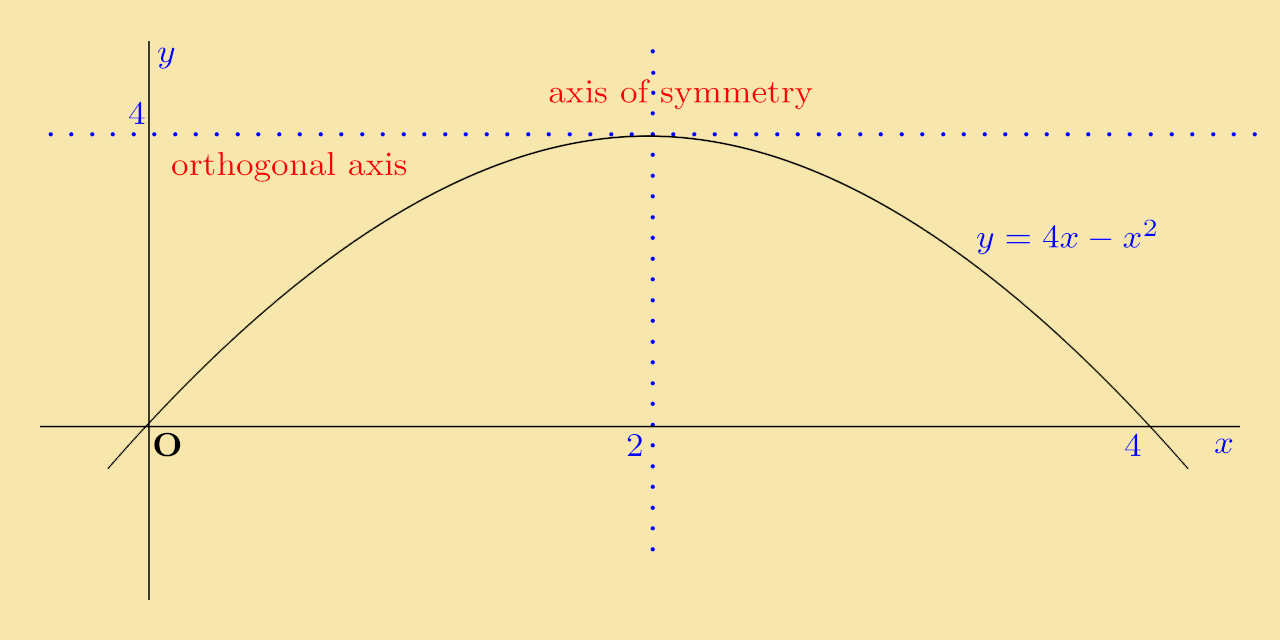
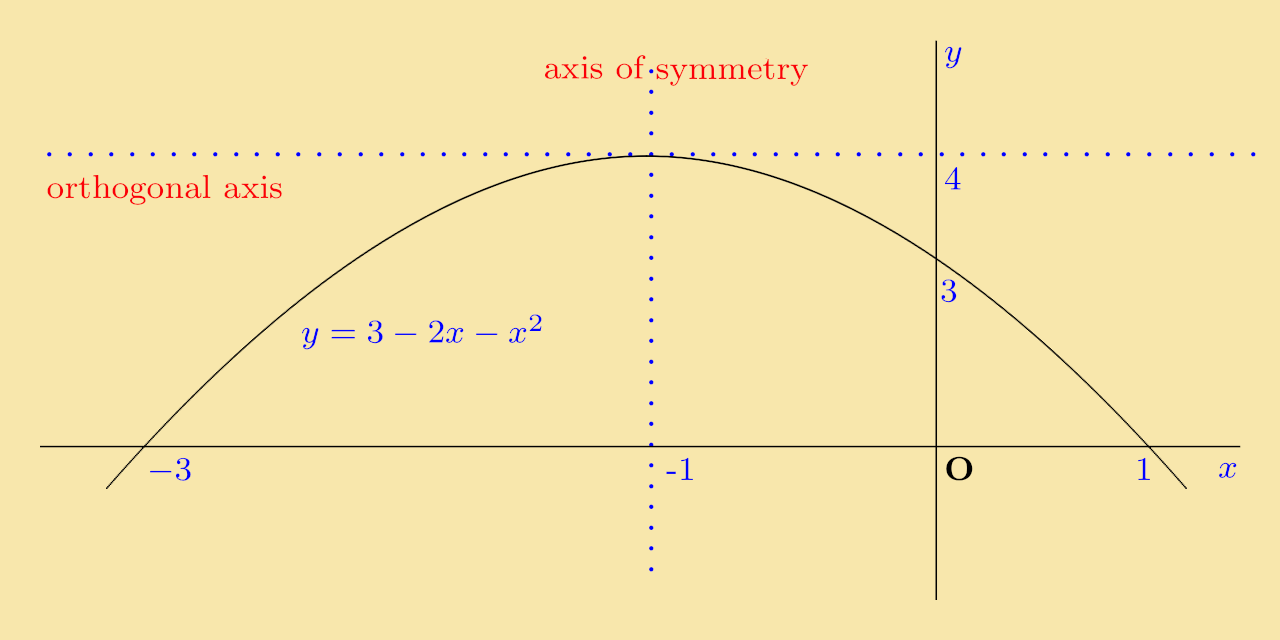
Solution: On completing the square, the function becomes y = −(x − 2)2 + 4. The graph is sketched below:
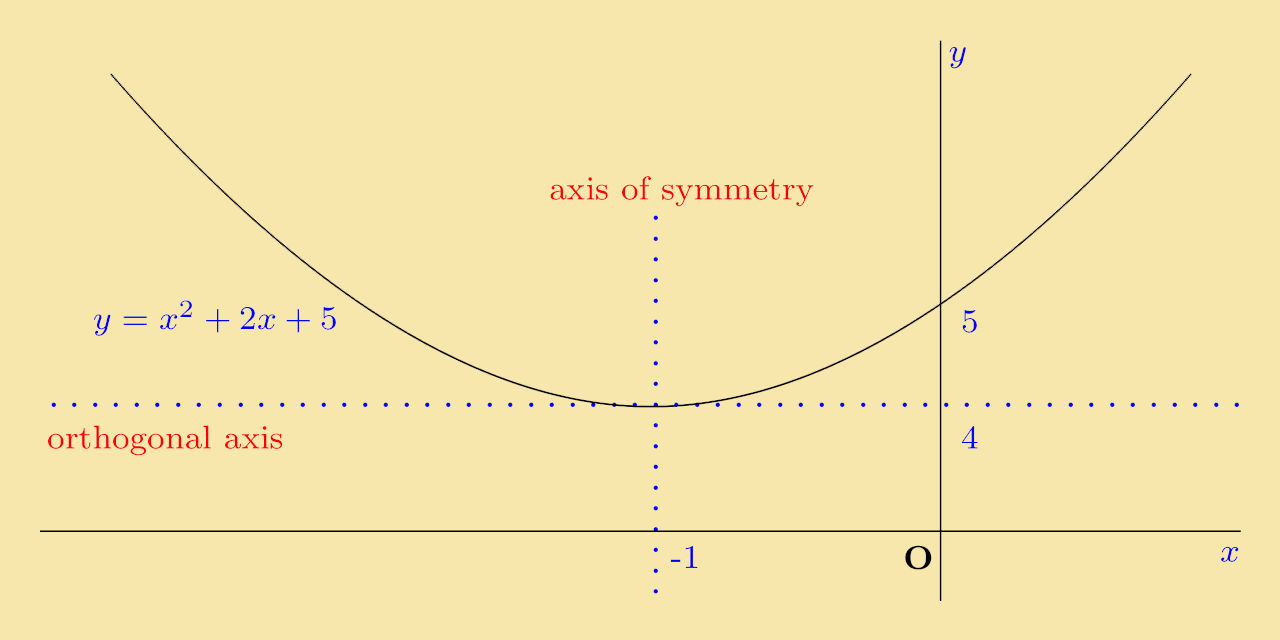
Solution: On completing the square, the function becomes y = (x + 1)2 + 4. The graph is sketched below:
Solution: On completing the square, this function becomes y = −(x + 1)2 + 4. This is sketched below:
Click on questions to reveal their solutions
This section ends with a short quiz:
Quiz 2: Which of the following pairs of lines is the axis of symmetry and orthogonal axis respectively of the quadratic function y = − 2x2 − 8x?
Explanation: Completing the square on y = −2x2 − 8x gives the function
y = −2 (x + 2)2 + 8
i.e. the orthogonal axis is y = 8 and the axis of symmetry is x = −2. This is exactly the function examined in Exercise 1, where the full details and sketch may be found.
4. Quiz on Quadratic Graphs
Each of the following questions relates to the quadratic function y = −x2 + 6x + 7.