1. Introduction
Many quantities in science can be described by equations of the form y=Axn. It is, though, not easy to distinguish between graphs of different power laws. Consider the data below:
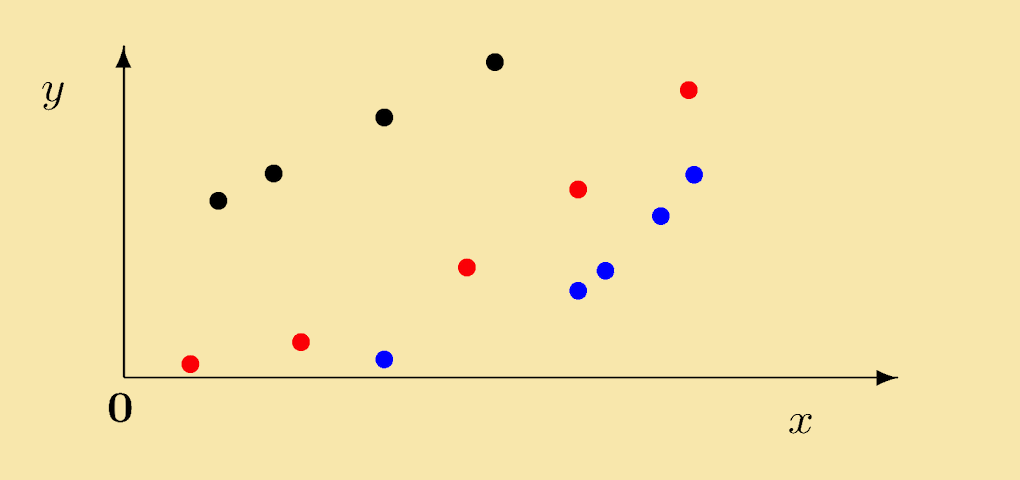
It is not easy to see that the red points lie on a quadratic (y = Ax2) and that the blue data are on a quartic (y = Ax4). It is, however, clear that the black points lie on a straight line. Results from the modules on Logarithms and Straight Lines enable us to recast the power curves as straight lines and so extract both n and A.
Example 1: Consider the equation y = xn. This is a power curve, but if we take the logarithm of each side we obtain:
| log (y) | = | log (xn) | |
| = | nlog (x) | since log (xn) = nlog (x) |
If Y = log (y) and X = log (x) then Y = nX. This shows the linear relationship. Plotting Y against X, i.e. log (y) against log (x), leads to a straight line as shown below.
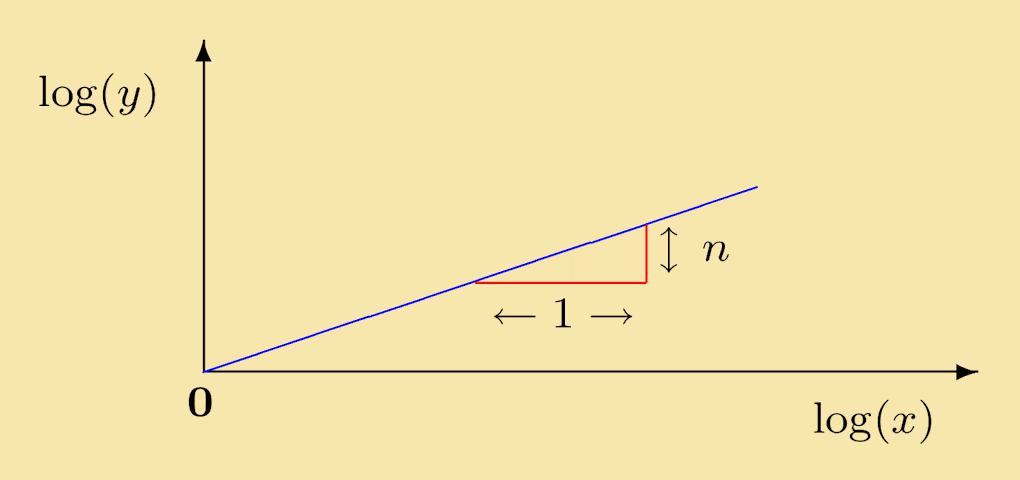
Here n is the slope of the line. Thus from a log-log plot, we can directly read off the power, n.
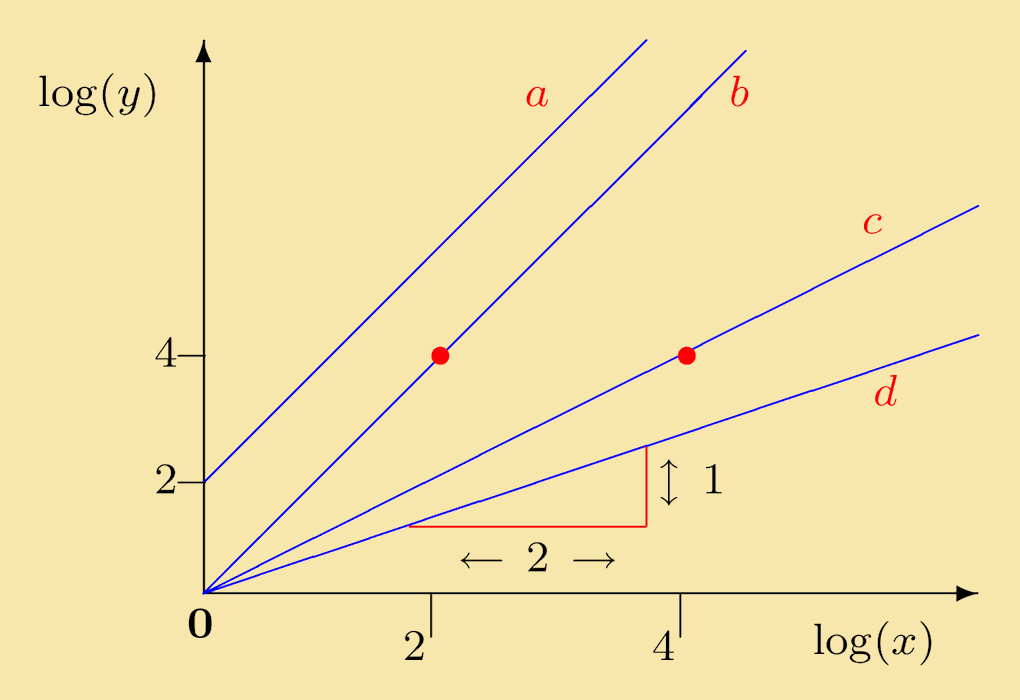
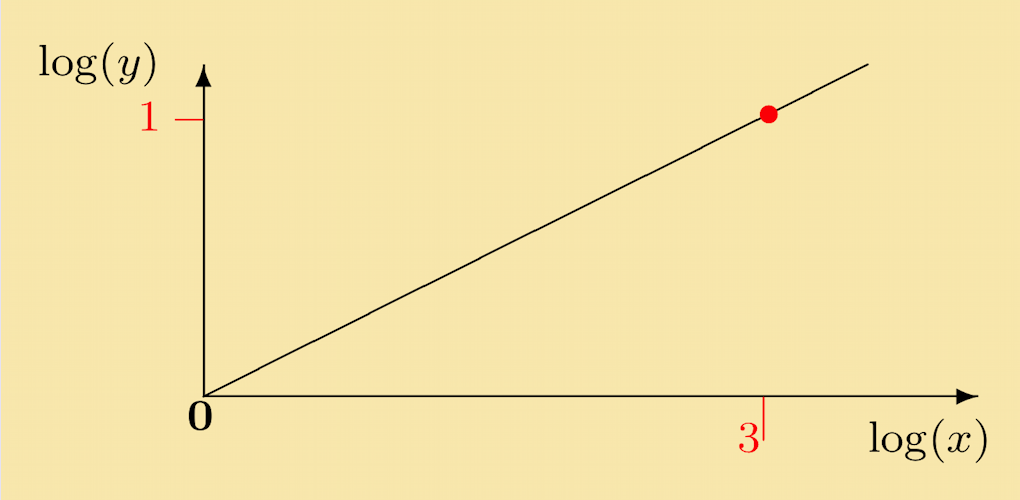
Quiz 1: Which of the following lines is a log-log plot of y = x2?
Explanation: The curve is y = x2. Taking logs of both sides gives:
i.e. the log-log plot is a straight line through the origin with gradient 2.
Line b passes though the origin and through the point (x = 2, y = 4). From the modules on Straight Lines we know that the gradient, m, of a straight line passing through (log (x1), log (y1)) and (log(x2), log (y2)) is given by:
We see that the gradient of line b is given by:
Therefore, line b is the correct log-log plot.
2. Straight Lines from Curves
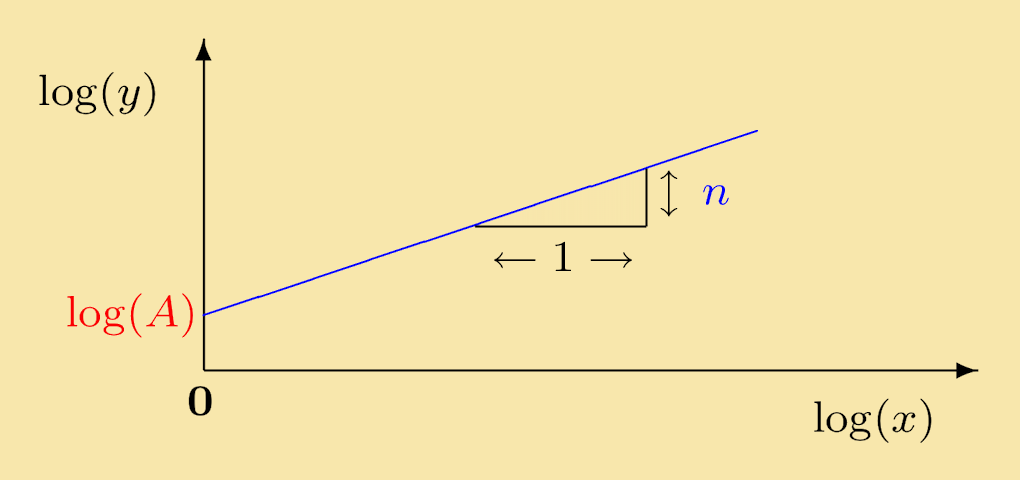
Example 2: Consider the more general equation y = Axn. Again, we take the logarithm of each side:
| log (y) | = | log (Axn) | |
| = | log (A) + log (xn) | since log (pq) = log (p) + log (q) | |
| ∴ log (y) | = | n log (x) + log (A) | since log (xn) = n log (x) |
The function log (y) is a linear function of log (x) and its graph is a straight line with gradient n which intercepts the log (y) axis at log (A).
Quiz 2: Referring to the lines a, b, c, d in the figure below, which of the following statements is not correct?
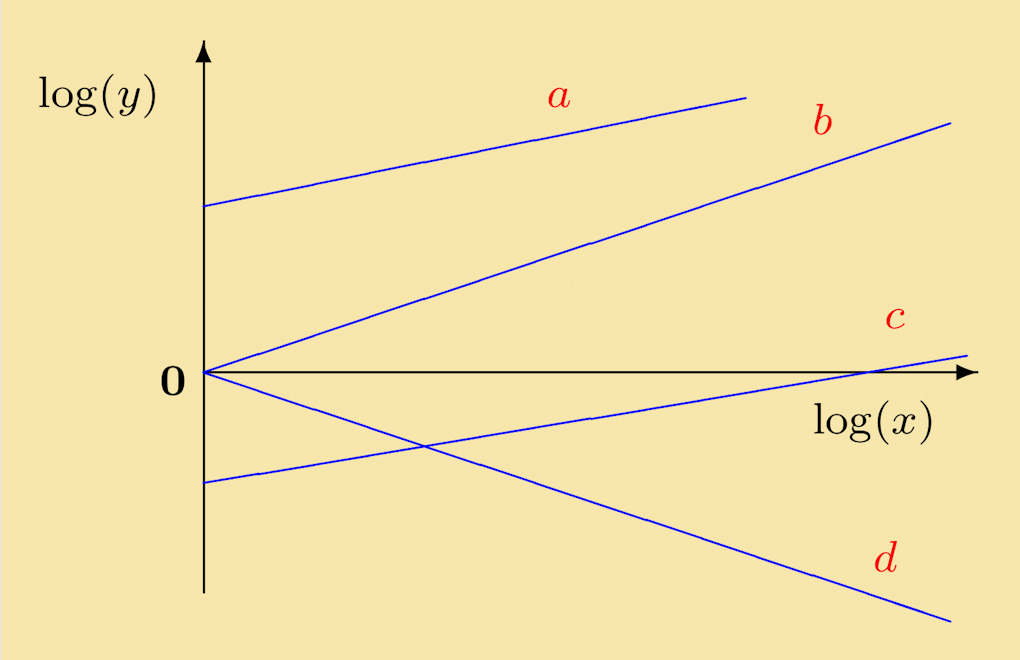
Explanation: If c corresponds to y = Axn, then log (y) = n log (x) + log (A). The intercept of line c on the log (y) axis is negative. This implies that log (A) < 0, which mean that 0 < A < 1. It does not signify that A itself is negative. (Of course, we also cannot take the logarithm of a negative number like this). It may be checked the other statements are correct.
Exercise 1: Produce log-log plots for each of the following power curves. In each case give the gradient and the intercept on the log (y) axis.
Solution: For y = x1/3, we get on taking logs: log (y) = 1/3log (x). This describes a line that passes through the origin and has slope 1/3. It is sketched below.
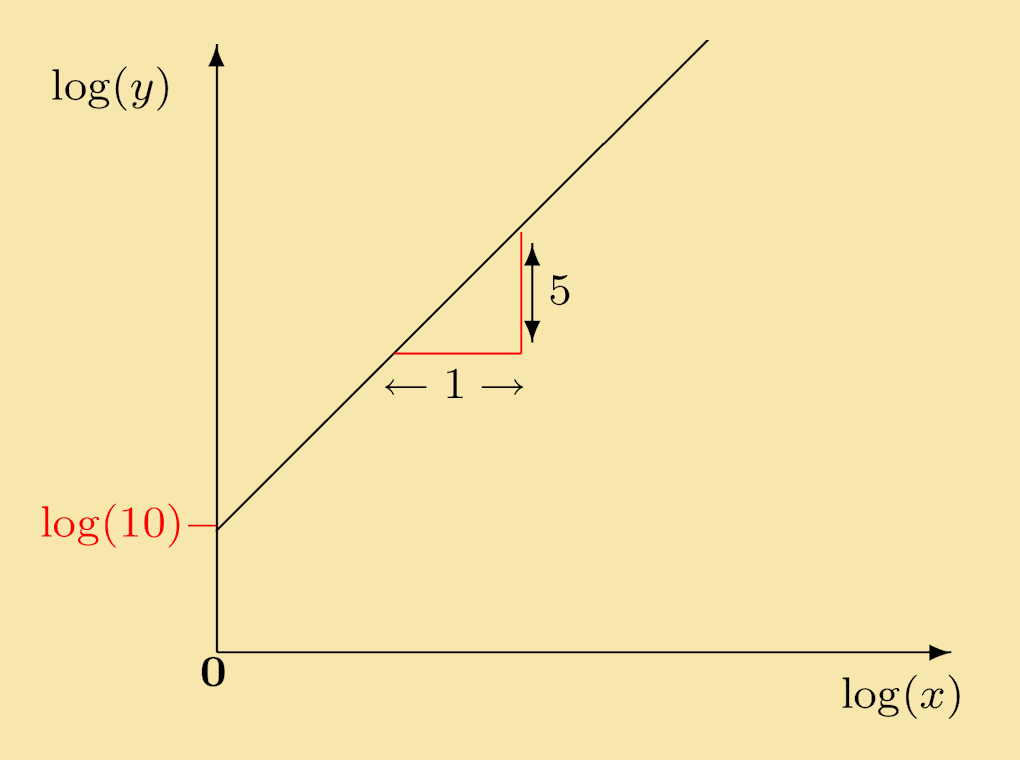
Solution: For y = 10x5, we get on taking logarithms of each side: log (y) = 5 log (x) + log (10). This describes a line that passes through (0, log (10)) and has slope 5. It is sketched below.
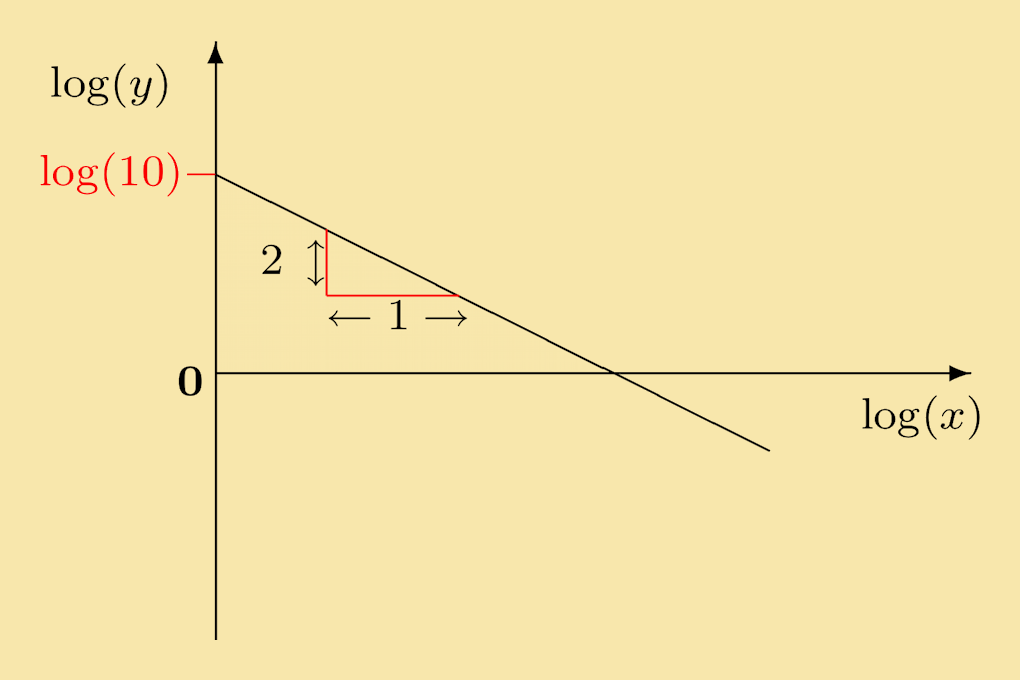
Solution: The relation y = 10x−2 can be re-expressed as log (y) = −2 log (x) + log (10). This is sketched below.
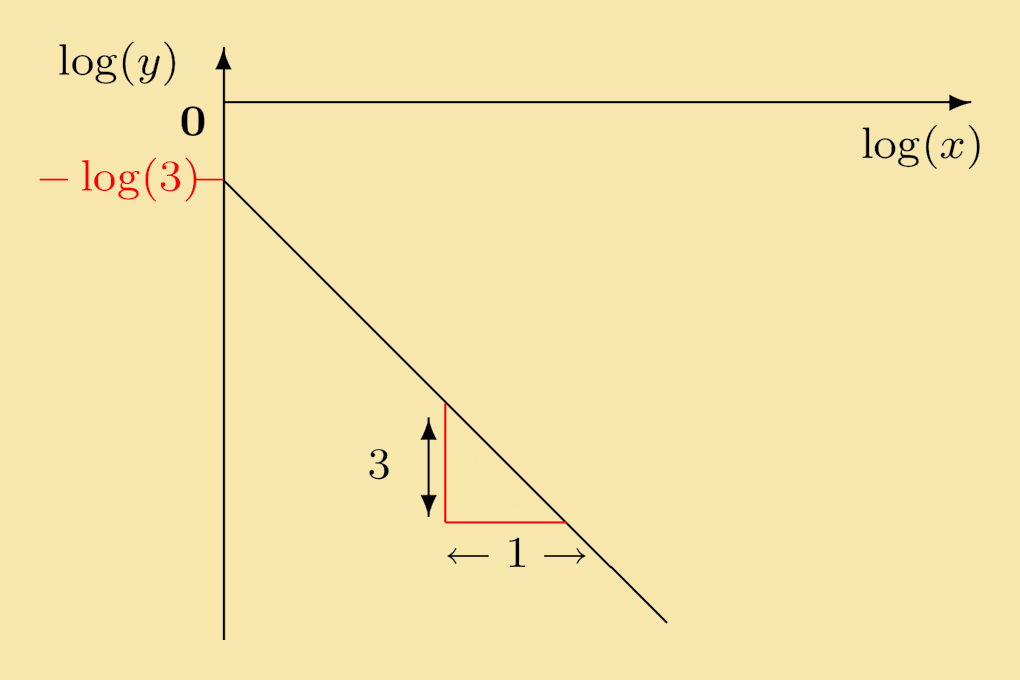
Solution: If 1/3 x−3, then log (y) = −3 log (x) + log ( 1/3 ). This can also be written as log (y) = −3 log (x) − log (3). It is the equation of a line with slope −3 and intercept at −log (3). This line is sketched below.
Click on questions to reveal their solutions
Quiz 3: How does changing the base of the logarithm used (e.g., using ln(x) instead of log10 (x)), change a log-log plot?
Explanation: The equation of a log-log plot is:
If we change the base of the logarithm that is used, then the gradient n is unchanged but the intercept A is altered.
For example, the log-log plot of y = 3x4 in terms of logarithms to the base 10 is:
- which has an intercept at log10 (3) = 0.477 (to 3 d.p.). Using natural logarithms the equation would become:
This has the same gradient, but the intercept on the ln (y)-axis is now at ln (3) = 1.099 (to 3 d.p.)
The only exception to this is if A = 1, since logN = 0 for all N.
Note: In an equation of the form y = 5 + 3x2, taking logs directly does not help. This is because there is no rule to simplify log (5 + 3x2). Instead, we have to subtract the constant from each side. We then get y − 5 = 3x2, which leads to the straight line equation log (y − 5) = 2 log (x) + log (3).
3. Fitting Data
Suppose we want to see if some experimental data fits a power law of the form, y = Axn. We take logs of both sides and plot the points on a graph of log (y) against log (x). If they lie on a straight line (within experimental accuracy) then we conclude that y and x are related by a power law and the parameters A and n can be deduced from the graph. If the points do not lie on a straight line, then x and y are not related by an equation of this form.
Example 3: Consider the following data:
| x | 2 | 30 | 70 | 100 | 150 |
|---|---|---|---|---|---|
| y | 4.24 | 16.4 | 25.1 | 30.0 | 36.7 |
To see if it obeys y = Axn, we take logarithms of both sides. Here we use logarithms to the base 10. This gives the following table:
| log10 (x) | 0.30 | 1.48 | 1.85 | 2.00 | 2.18 |
|---|---|---|---|---|---|
| log10 (y) | 0.63 | 1.21 | 1.40 | 1.48 | 1.56 |
These points are plotted in the figure below.

It is evident that the red data points lie on a straight line. Therefore the original x and y values are related by a power law y = Axn. To find the values A and n, we first continue the line to the log10 (y)-axis which it intercepts at the blue dot: log10 (A) = 0.48. This means that A = 100.48 = 3.0 (to 1 d.p.).
The gradient of the line is esimated using two of the points
So the original data lies on the curve y = 3x1/2
Exercise 2:
Solution: y = √ 4x + 4 can be re-expressed as follows:
Subtract 4 from each side:
| y − 4 | = | √ 4x |
| y − 4 | = | 2 √ x |
| y − 4 | = | 2x1/2 |
Taking logarithms of each side yields
Thus plotting log (y−4) against log (x) would give a straight line with slope 1/2 and intercept log (2) on the log (y−4)-axis.
Solution: If y = Axn then the log-log plot is the graph of the straight line
So if the slope is the same, the power n is the same in each case.
If the coefficients A1 and A2 differ by
| log (A1) − log (A2) | = | log (3) |
| log ( A1A2 ) | = | log (3), since log (p/q) = log (p) − log (q) |
So it follows that the coefficients are related by A1 = 3 A2
| x | 5 | 15 | 30 | 50 | 95 |
|---|---|---|---|---|---|
| y | 10 | 90 | 360 | 1000 | 3610 |
Solution: To see if it obeys y = Axn, we take logarithms to the base 10 of both sides. The table and graph are below.
| log10 (x) | 0.70 | 1.18 | 1.48 | 1.70 | 1.98 |
|---|---|---|---|---|---|
| log10 (y) | 1 | 1.95 | 2.56 | 3.00 | 3.56 |
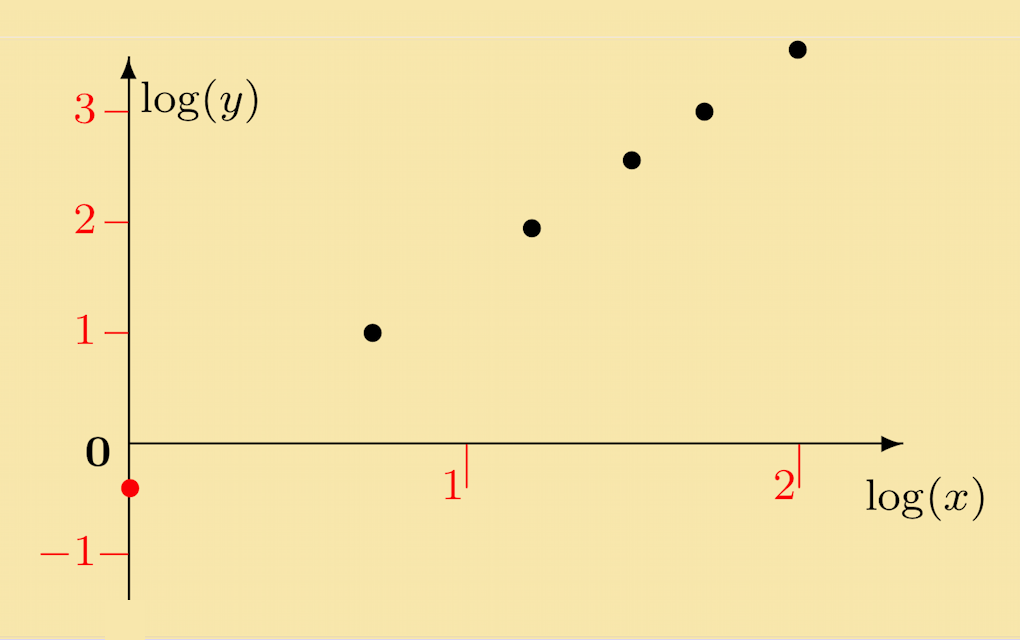
The data points are fitted by a line that intercepts the log10 (y) axis at log (A) = −0.40, so A = 10−0.40 = 0.4. The gradient can be calculated from n = (3 − 1) / (1.70 − 0.70) = 2. So the data lie on the straight line y = 0.4x2.
Click on questions to reveal their solutions
4. Quiz on Log-Log Plots
Choose the solutions from the options given
1.What are the intercept and slope respectively of the log-log plot of y=0.5x2?
2.If the log (y)-axis intercept of the log-log plot of y = Axn is negative, which of the following is true?
3.The data below obeys a power law, y = Axn. Obtain the equation and select the correct statment.
| x | 5 | 15 | 30 | 50 | 95 |
|---|---|---|---|---|---|
| y | 4.47 | 7.75 | 10.95 | 14.14 | 19.49 |