PHYS 6.1: Light – a wave phenomenon |
PPLATO @ | |||||
PPLATO / FLAP (Flexible Learning Approach To Physics) |
||||||
|
1 Opening items
1.1 Module introduction
Light is vital to life. There would be no life on Earth without the energy from the Sun and much of that energy is transferred by visible light. How is the energy transmitted through space and how it is delivered on arrival? Are each of these processes analogous to the passage of particles (like bullets from a gun) or waves (like waves on a beach)? Experiments must decide which is the more appropriate mechanism, waves or particles, but let us look at the alternatives for a moment.
Particles might be expected to travel in straight lines and to form sharp edged shadows, but waves are able to travel around obstacles and might therefore blur the edges of shadows. Particles would be expected to travel large distances carrying their energy with them, but a wave usually results from the coordinated local motion of many neighbouring parts that pass energy from one to another – the parts themselves don’t usually travel very far, and what movements they do make may take place in any direction relative to the direction of energy flow. Despite these gross differences between waves and particles, the battle over the true nature of light raged for a very long time. Isaac Newton (1642–1727), for example, favoured a sophisticated form of particle, while Christiaan Huygens (1629–1695) favoured the wave mechanism.
The matter finally appeared settled in 1801 when a British physician, Thomas Young (1773–1829), detected clear signs of wave–like behaviour. It only remained, it seemed, for those who came after to elaborate the wave model and to determine the nature of the waves.
This was achieved in 1864, by James Clerk Maxwell (1831–1879), when he showed that oscillating electric and magnetic fields can propagate (i.e. travel) as an electromagnetic wave through space or various materials. But even these discoveries were later to be seen in a new way as the development of quantum theory allowed the debate to continue into the 20th century.
It is not only physicists who have been fascinated for hundreds of years by the nature of light. Almost everyone has marvelled at the way the colours of a peacock’s tail, or of an oil film on water, change as they are viewed from different angles. In this module you will see how both these observations provide powerful clues to the nature of light.
This module describes the wave model of light. Section 2 will introduce you to Maxwell’s electromagnetic waves and show how they account for various properties of light such as colour and polarization. Section 3 sets out Huygens’ principle, an idea that predates Maxwell’s work but which is nonetheless able to provide insight into the transmission or propagation of light, including such important phenomena as diffraction, reflection and refraction. In Section 4 the intensity of light waves is defined. This leads to a discussion of the transfer of energy by light and of the inverse square law of illumination. Finally, in Section 5, the superposition principle is introduced and used to explain various aspects of interference, including Young’s experiment, reflection from thin films, the operation of diffraction gratings and the phenomenon of Fraunhofer diffraction at a single slit. It is this final section that deals with the oil film and the peacock’s tail.
Study comment Having read the introduction you may feel that you are already familiar with the material covered by this module and that you do not need to study it. If so, try the following Fast track questions. If not, proceed directly to the Subsection 1.3Ready to study? Subsection.
1.2 Fast track questions
Study comment Can you answer the following Fast track questions? If you answer the questions successfully you need only glance through the module before looking at the Subsection 6.1Module summary and the Subsection 6.2Achievements. If you are sure that you can meet each of these achievements, try the Subsection 6.3Exit test. If you have difficulty with only one or two of the questions you should follow the guidance given in the answers and read the relevant parts of the module. However, if you have difficulty with more than two of the Exit questions you are strongly advised to study the whole module.
Question F1
Draw diagrams to show how Huygens’ principle may be used to demonstrate the laws of reflection and refraction of light.
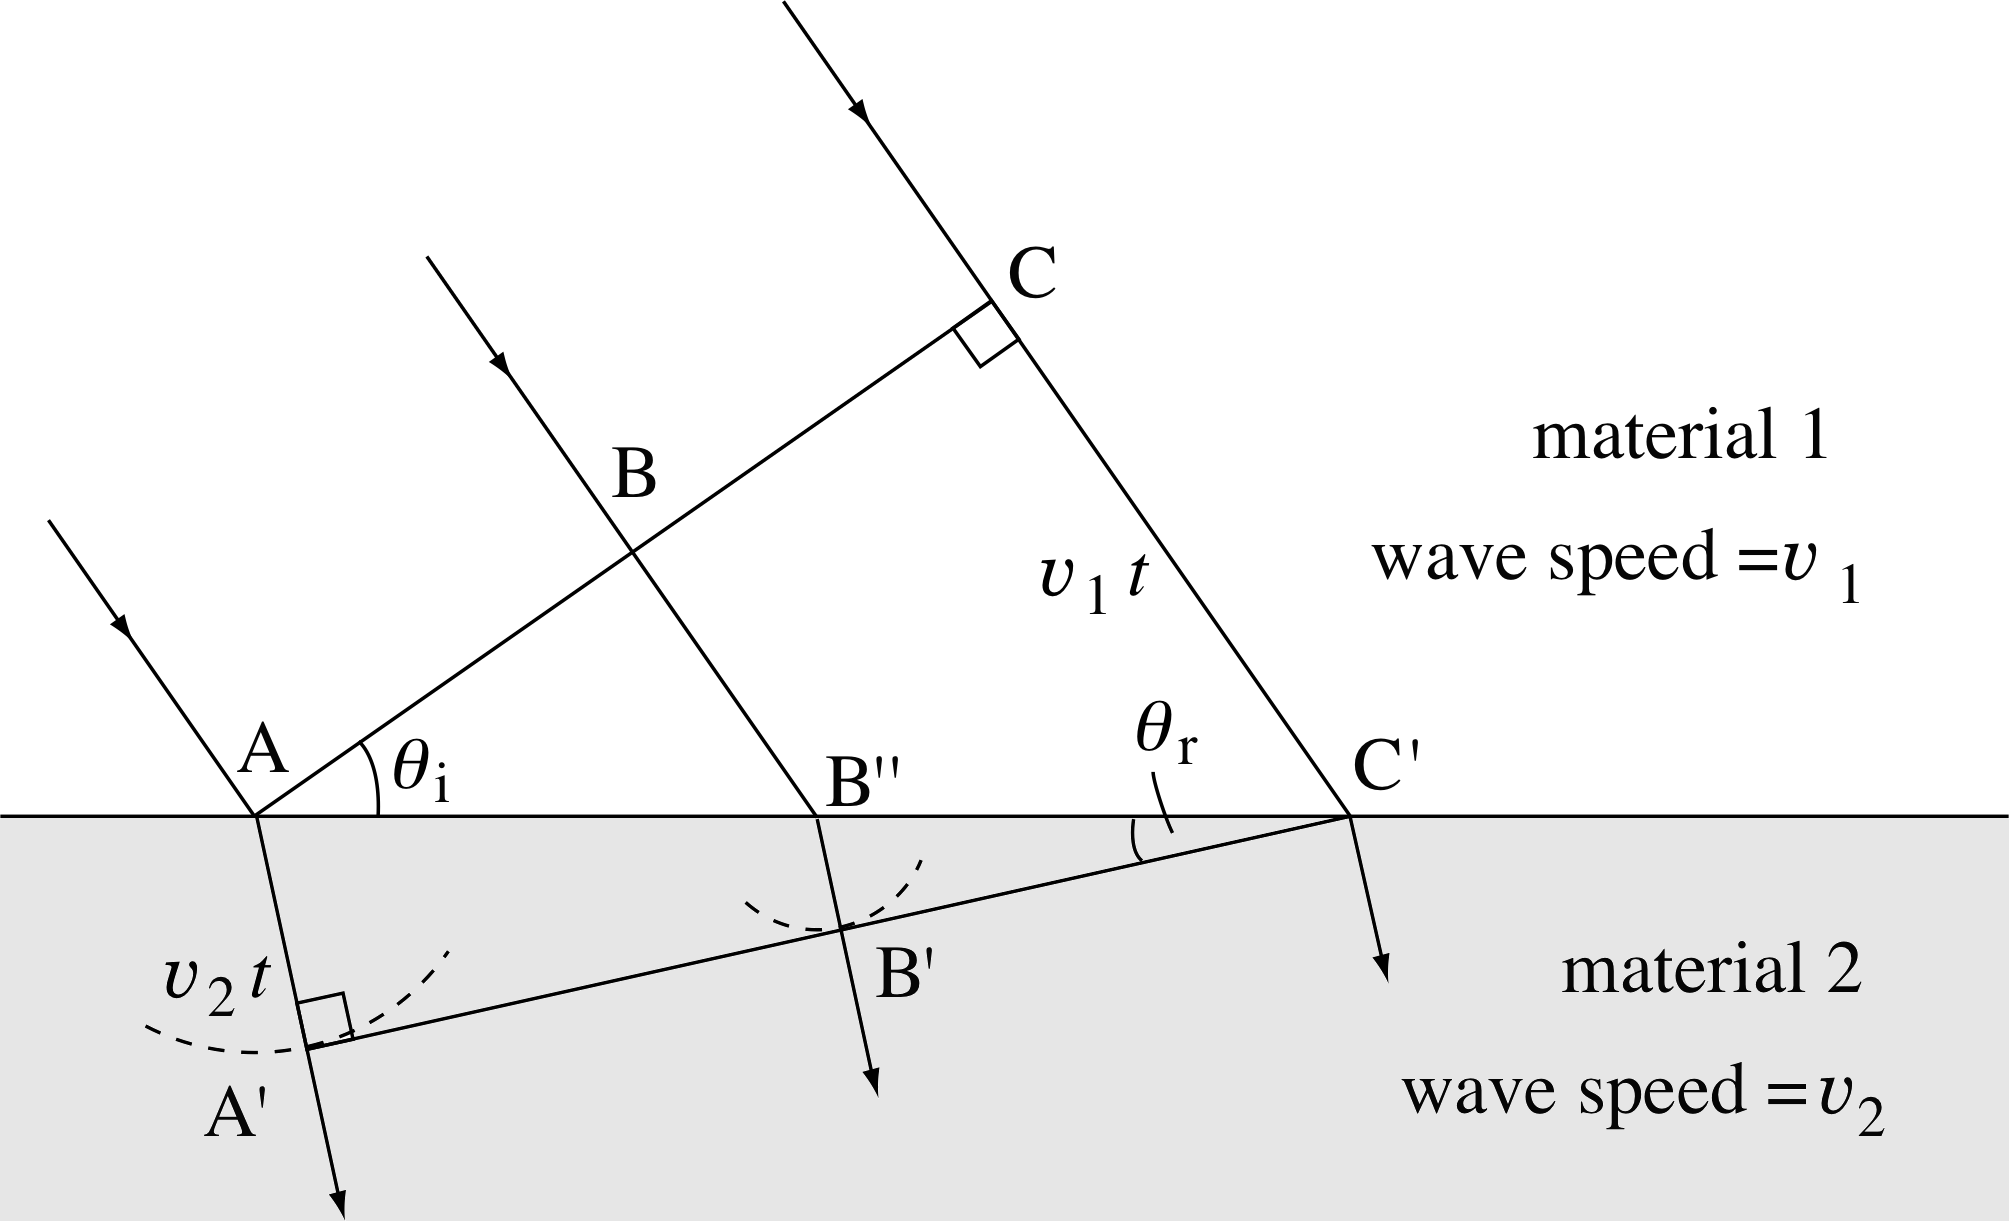
Figure 7 The refraction of a wavefront (reflection not shown). Note that the angles marked θi and θr are not themselves the angles of incidence and refraction, but they are equal to those angles.
Answer F1
See Figures 5 and 7 and Subsections 3.4 and 3.5.
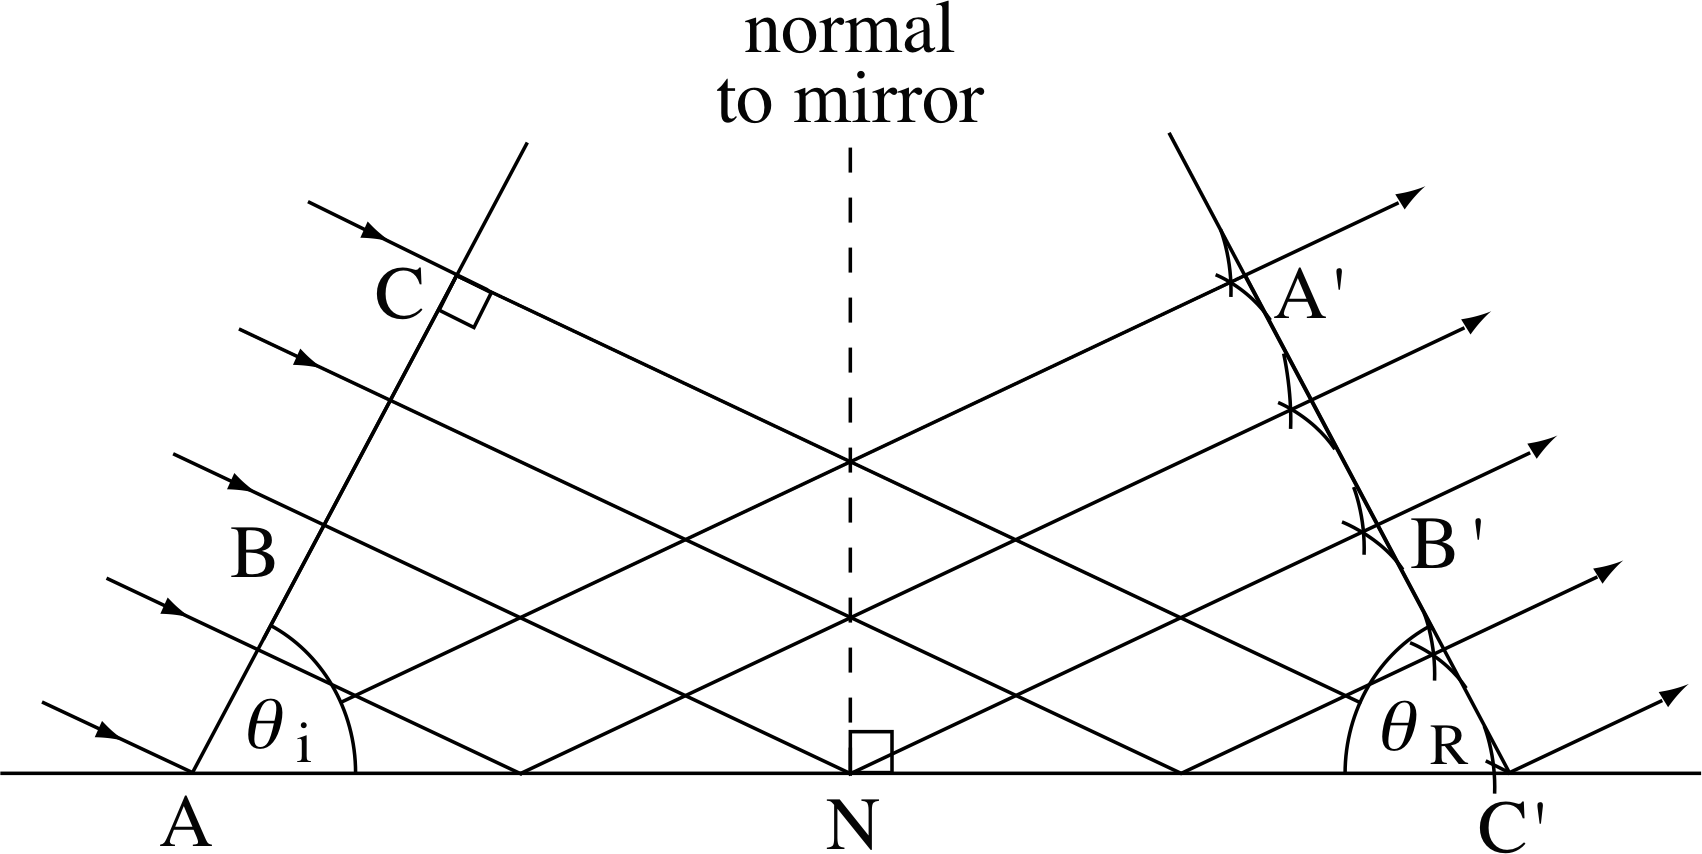
Figure 5 The reflection of a wavefront (reflection not shown). Note that the angles marked θi and θR are not themselves the angles of incidence and reflection, but they are equal to those angles.
Question F2
Light of wavelength 550 nm in a vacuum, passes into a block of glass where its speed is 2.10 × 10⁸ m s−1. What is the frequency and wavelength of the light in the glass?
Answer F2
The speed of light in vacuum: c = f λ = 3 × 10⁸ m s−1. The speed in a material with refractive index μ is c/μ. However, the frequency remains unchanged, so:
$f = \rm \dfrac{3\times10^8\,m\,s^{-1}}{550\times10^{-9}\,m} = 5.45\times10^{14}\,Hz$
The wavelength is reduced by the factor μ so that λ = 550 nm × 2.10 × 108/(3.0 × 108) = 385 nm.
Question F3
What is meant by polarized light? Give your answer in terms of the directions of the electric and magnetic fields. What is unpolarized light?
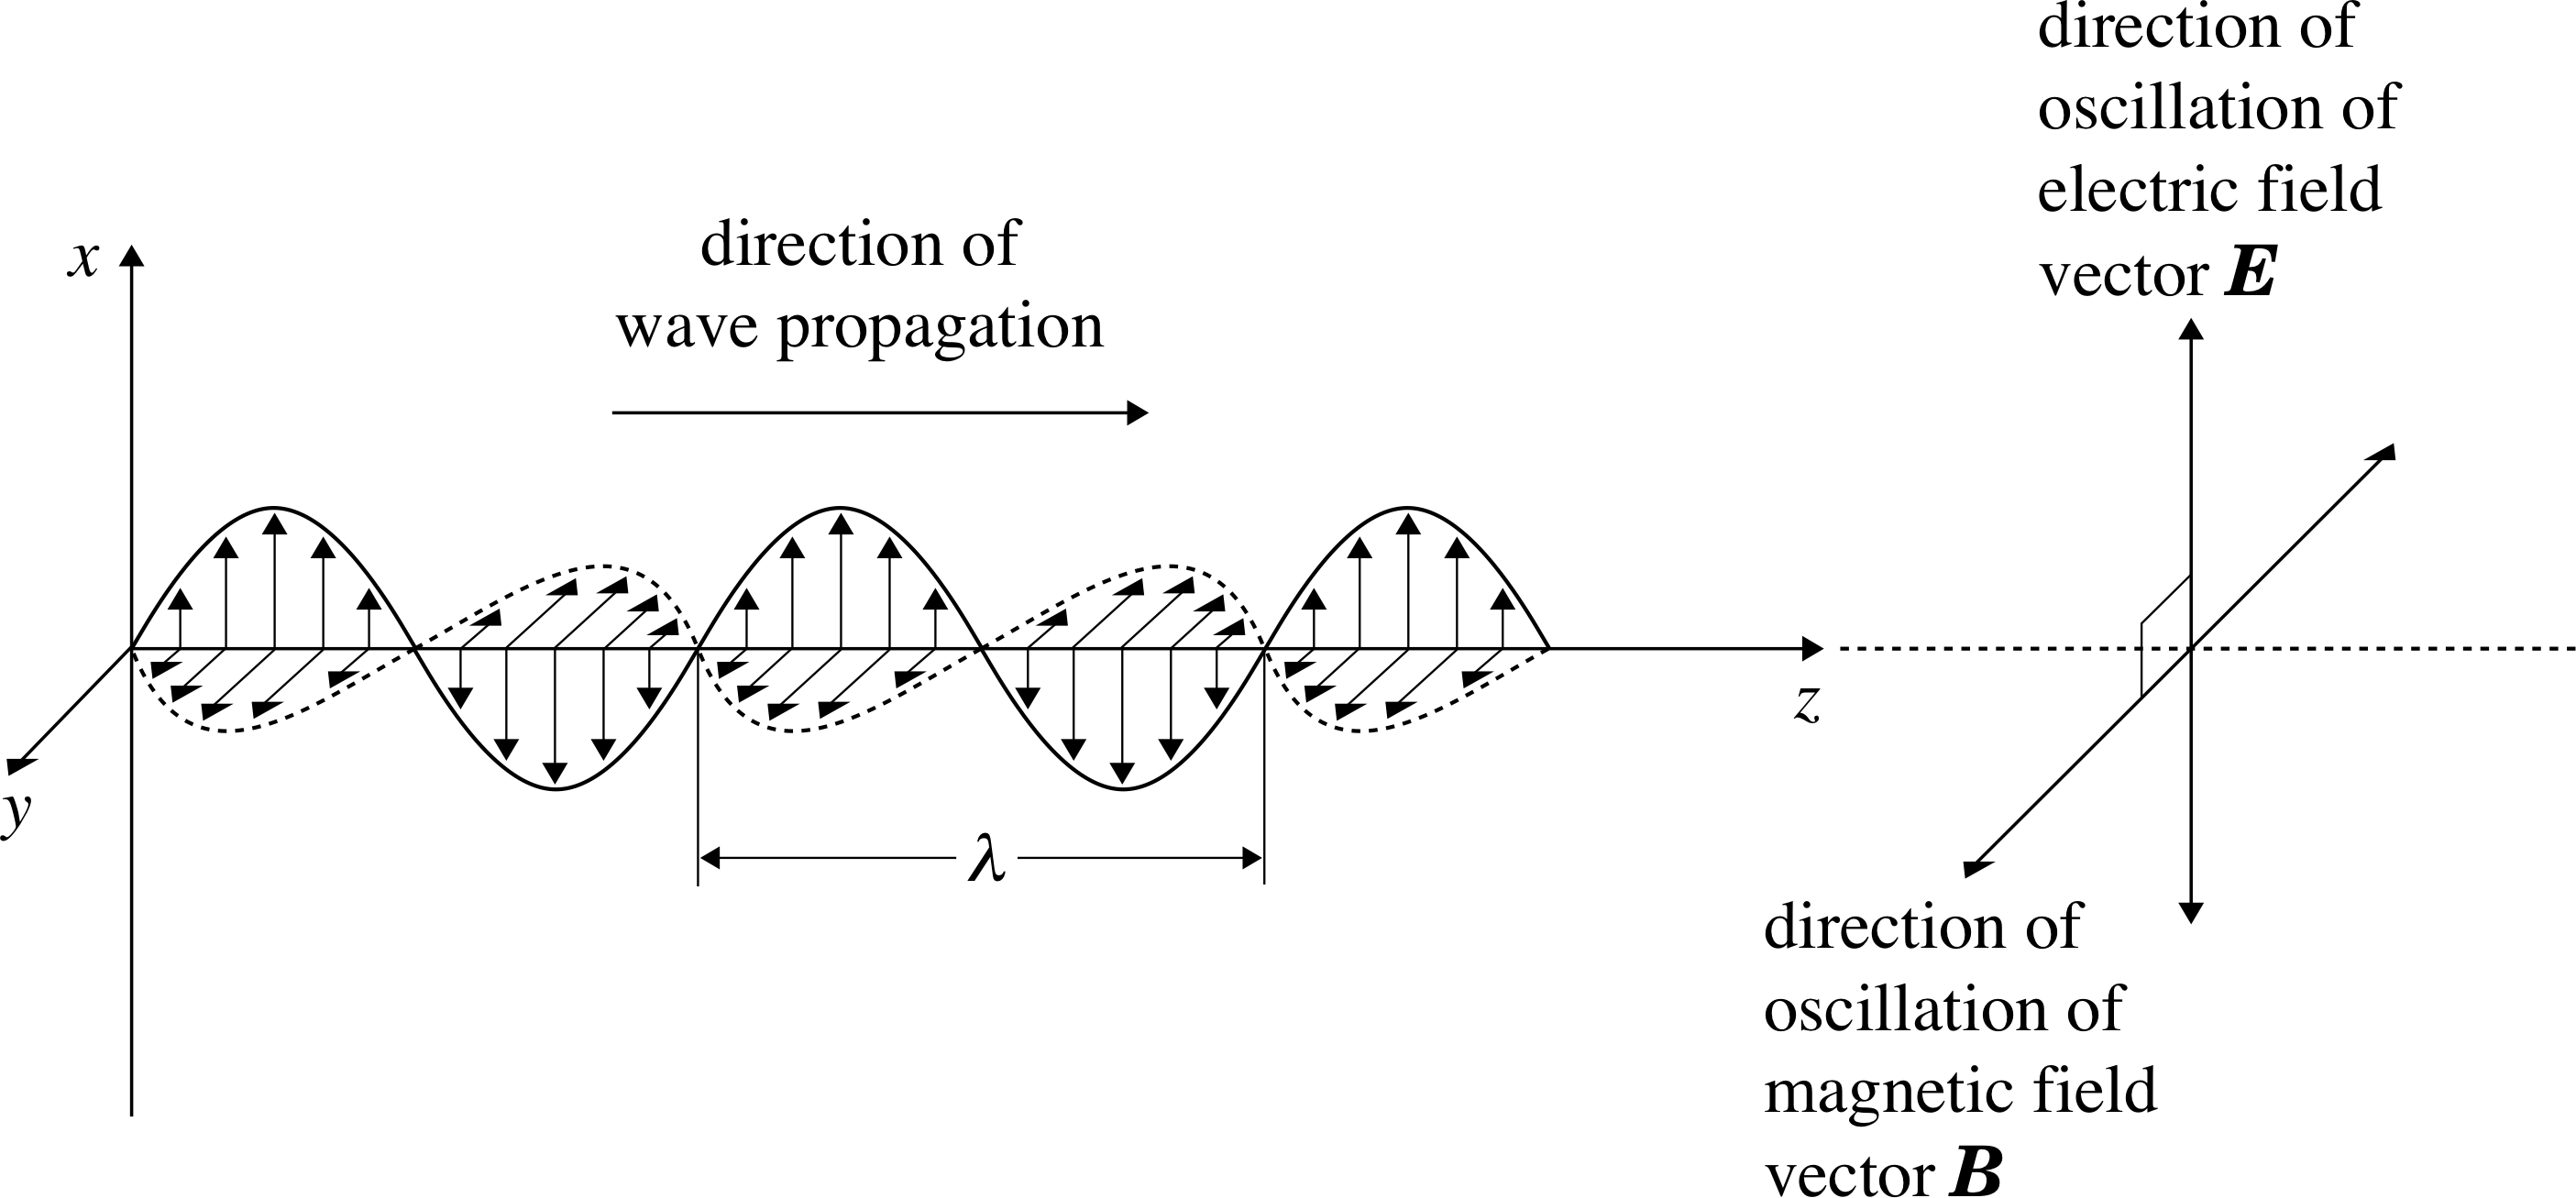
Figure 1 An instantaneous snapshot showing the varying magnitude and direction of the electric field E and magnetic field B at points along the path of the simplest kind of electromagnetic wave.
Answer F3
Consider a light wave travelling along the z–axis; if the electric field is oscillating along the x–axis we say the light is polarized in the x–direction. The magnetic field oscillates in phase with the electric field and is along the y–axis (see, for example, Figure 1). If the light is unpolarized the electric field direction varies rapidly and randomly, but is always perpendicular to the z-axis.
Question F4
In a particular Young’s two–slit experiment, light of wavelength 600 nm is used. Find the separation of the slits if the first order interference maximum appears at an angle of 0.15°.
Answer F4
The angles of the interference maxima are given by nλ = d sin θn. If λ = 600 nm, θn = 0.15° and n = 1, the slit separation is given by:
$d = \rm \dfrac{600\times10^{-9}\,m}{\sin0.15°} = 2.29\times10^{-4}\,m = 229\,\mu m$
Question F5
What is meant by the term diffraction? Describe the essential characteristics of a diffraction grating.
Answer F5
Diffraction is a general term describing what happens when a wavefront interacts with an aperture or an obstacle. Waves spread out or diffract when emerging from an aperture. The smaller the aperture the greater the spreading. A diffraction grating has several thousand regularly spaced parallel slits. For an analysis of visible light, the spacing of the slits is usually of the order of 10−6 m. Each monochromatic plane wave incident on the grating is diffracted into a series of very narrow interference maxima.
1.3 Ready to study?
Study comment In order to study this module you will need to be familiar with the following terms: Cartesian coordinates, displacement, direction_of_a_vectordirection (of a vector), electric field, energy, magnetic field, magnitude_of_a_vector_or_vector_quantitymagnitude_of_a_vector_or_vector_quantitymagnitude (of a vector), oscillation, power, SI units, speed and vector. You will also need an everyday notion of what constitutes wave_equationwave motion. The mathematical requirements include the use of radians to measure angles, the basic geometry of triangles, and basic trigonometry. If you are uncertain about any of these terms, or how to use them, refer to the Glossary which will indicate where in FLAP they are explained. The following Ready to Study questions will help you to check that you have the required level of skills and knowledge.
Question R1
Describe in one sentence what is meant by an oscillation.
Answer R1
An oscillation is some sort of regular back and forth motion.
Comment One of the most important examples of oscillation is simple harmonic motion, an example of which would be a particle moving back and forth along the x–axis of a Cartesian coordinate system in such a way that its position coordinate x at any time t is given by:
x (t) = A sin(ωt + ϕ)
where A (the amplitude), (the angular frequency) and ϕ (the phase constant) are constants that characterize the motion.
Question R2
How would you detect the presence of an electric field in some region of space?
Answer R2
An electric field would exert a force on a charged particle (F = qE).
Question R3
If the village of Smallplace is 20 miles north of the city of Bigplace, what is the magnitude and direction of the displacement vector from Smallplace to Bigplace?
Answer R3
The magnitude_of_a_vector_or_vector_quantitymagnitude would be 20 miles, (magnitudes are never negative!) and the direction would be due south.
Comment If you had difficulty with any of these Ready to study questions consult the Glossary for further information.
2 The wave model of light
2.1 Light in a vacuum
In his pioneering investigation of electric and magnetic fields James Clerk Maxwell was able to construct a theory of electromagnetism which made a crucial prediction. i This was that oscillating electric and magnetic fields could travel through space as an electromagnetic wave – a pattern of fluctuating electric and magnetic fields that could tumble together through a vacuum at a speed equal to the known speed of light.
The German physicist Heinrich R. Hertz (1857–1894) succeeded in generating electromagnetic waves (of the type we now call radiowaves) in 1888. He showed that they behaved like light in many respects and that their speed was indeed the same as the speed of light. i This confirmed Maxwell’s prediction and helped to establish the idea that light itself is an electromagnetic wave phenomenon.
The nature of an electromagnetic wave needs careful consideration. Various kinds of waves are important in physics but few are as subtle as electromagnetic waves. For many sorts of waves it is easy to visualize what is actually ‘waving’. In the case of sound waves in air, for example, the density or pressure of the air varies as individual molecules oscillate back and forth along the path of the sound wave. In the case of the waves that travel along a horizontal rope being shaken at one end, it is the rope itself that moves as its various parts oscillate at right angles to the direction of the travelling wave.
Figure 1 An instantaneous snapshot showing the varying magnitude and direction of the electric field E and magnetic field B at points along the path of the simplest kind of electromagnetic wave.
Electromagnetic waves are rather different; nothing moves as such, but at every point along the path of the wave there will be an oscillating electric field E and an oscillating magnetic field B. Both of these fields are vector quantities, so each has its own magnitude_of_a_vector_or_vector_quantitymagnitude and direction that may change from place to place and from one moment to the next. It is these magnitudes and directions that vary during the passage of an electromagnetic wave, just as the air pressure at a point varies during the passage of a sound wave.
The oscillating fields in an electromagnetic wave always have to be related in a very particular way. This is indicated in Figure 1 which shows a snapshot of the simplest kind of electromagnetic wave at a particular instant of time. There are several points to notice about this wave:
- The wave is travelling along a fixed direction known as the direction of propagation. In this case we have chosen to make it the z–axis of a system of Cartesian coordinates.
- The wave is travelling at the speed of light. In a vacuum this is defined to be 299 792 458 m s−1. i It is customary to represent this speed by c and it is worth noting that to three significant figures:
c = 3.00 × 10⁸ m s−1 (in a vacuum)
- At every point on the z–axis the electric and magnetic fields are at right angles to the direction of propagation – electromagnetic waves are therefore said to be transverse waves.
- At every point on the z–axis the electric and magnetic fields are at right angles to one another. In this case we have chosen to orientate the axes so that the electric and magnetic fields oscillate along the x and y–axes, respectively.
If you look along the direction of propagation (i.e. the z–axis in Figure 1), a clockwise rotation of 90° is needed to go from the electric field direction to the magnetic field direction at any instant of time.
- The electric and magnetic fields vary sinusoidally and they do so together (i.e. they are in phase). A characteristic property of each field is its maximum magnitude. This is called its amplitude and may be denoted by E0 and B0 for the electric and magnetic fields, respectively. Although it is not obvious from the figure, the ratio of the field magnitudes, E/B at any point, is fixed and in a vacuum is equal to the speed of light, so :
E/B = E0/B0 = c (in a vacuum)
- Both the electric and the magnetic fields are characterized by a common wavelength λ which is equal to the distance between corresponding parts of the wave (e.g. from one peak to the next).
- Since the wave has a particular wavelength and moves with a known speed the number of wavelengths that will pass a fixed point in one second is easy to calculate. That number per second is called the frequency f of the wave and is given by f = c/λ. Thus, in a vacuum :
c = f λ (in a vacuum)
- Since f determines the number of wavelengths that pass a fixed point in one second, the time required for one wavelength to pass a fixed point will be 1/f. This time is called the period T of the wave and is given by:
T = 1/f
✦ (a) The SI unit of frequency is the hertz (Hz), where 1 Hz = 1 s−1. What is the SI unit of period T?
(b) The SI unit of electric field strength (i.e. magnitude) is the volt per metre (V m−1) where 1 V m−1 = 1 kg m s 2 C−1, and the SI unit of magnetic field strength is the tesla (T), where 1 T = 1 kg s−1 C−1. Confirm that the ratio of electric and magnetic field amplitudes, E0/B0, can be measured in the same units as the speed of light in a vacuum, c, as implied above.
✧ (a) Since T = 1/f, the unit of period must be Hz−1 = s, as you would expect.
(b) The units of E0/B0 must be (kg m s−2 C−1)/(kg s−1 C−1) = m s−1 which are indeed the same units as those of the speed of light in a vacuum.
Electromagnetic waves of different wavelength differ markedly in their properties. Collectively they make up the electromagnetic spectrum shown in Figure 2a, of which visible light is just one small segment.
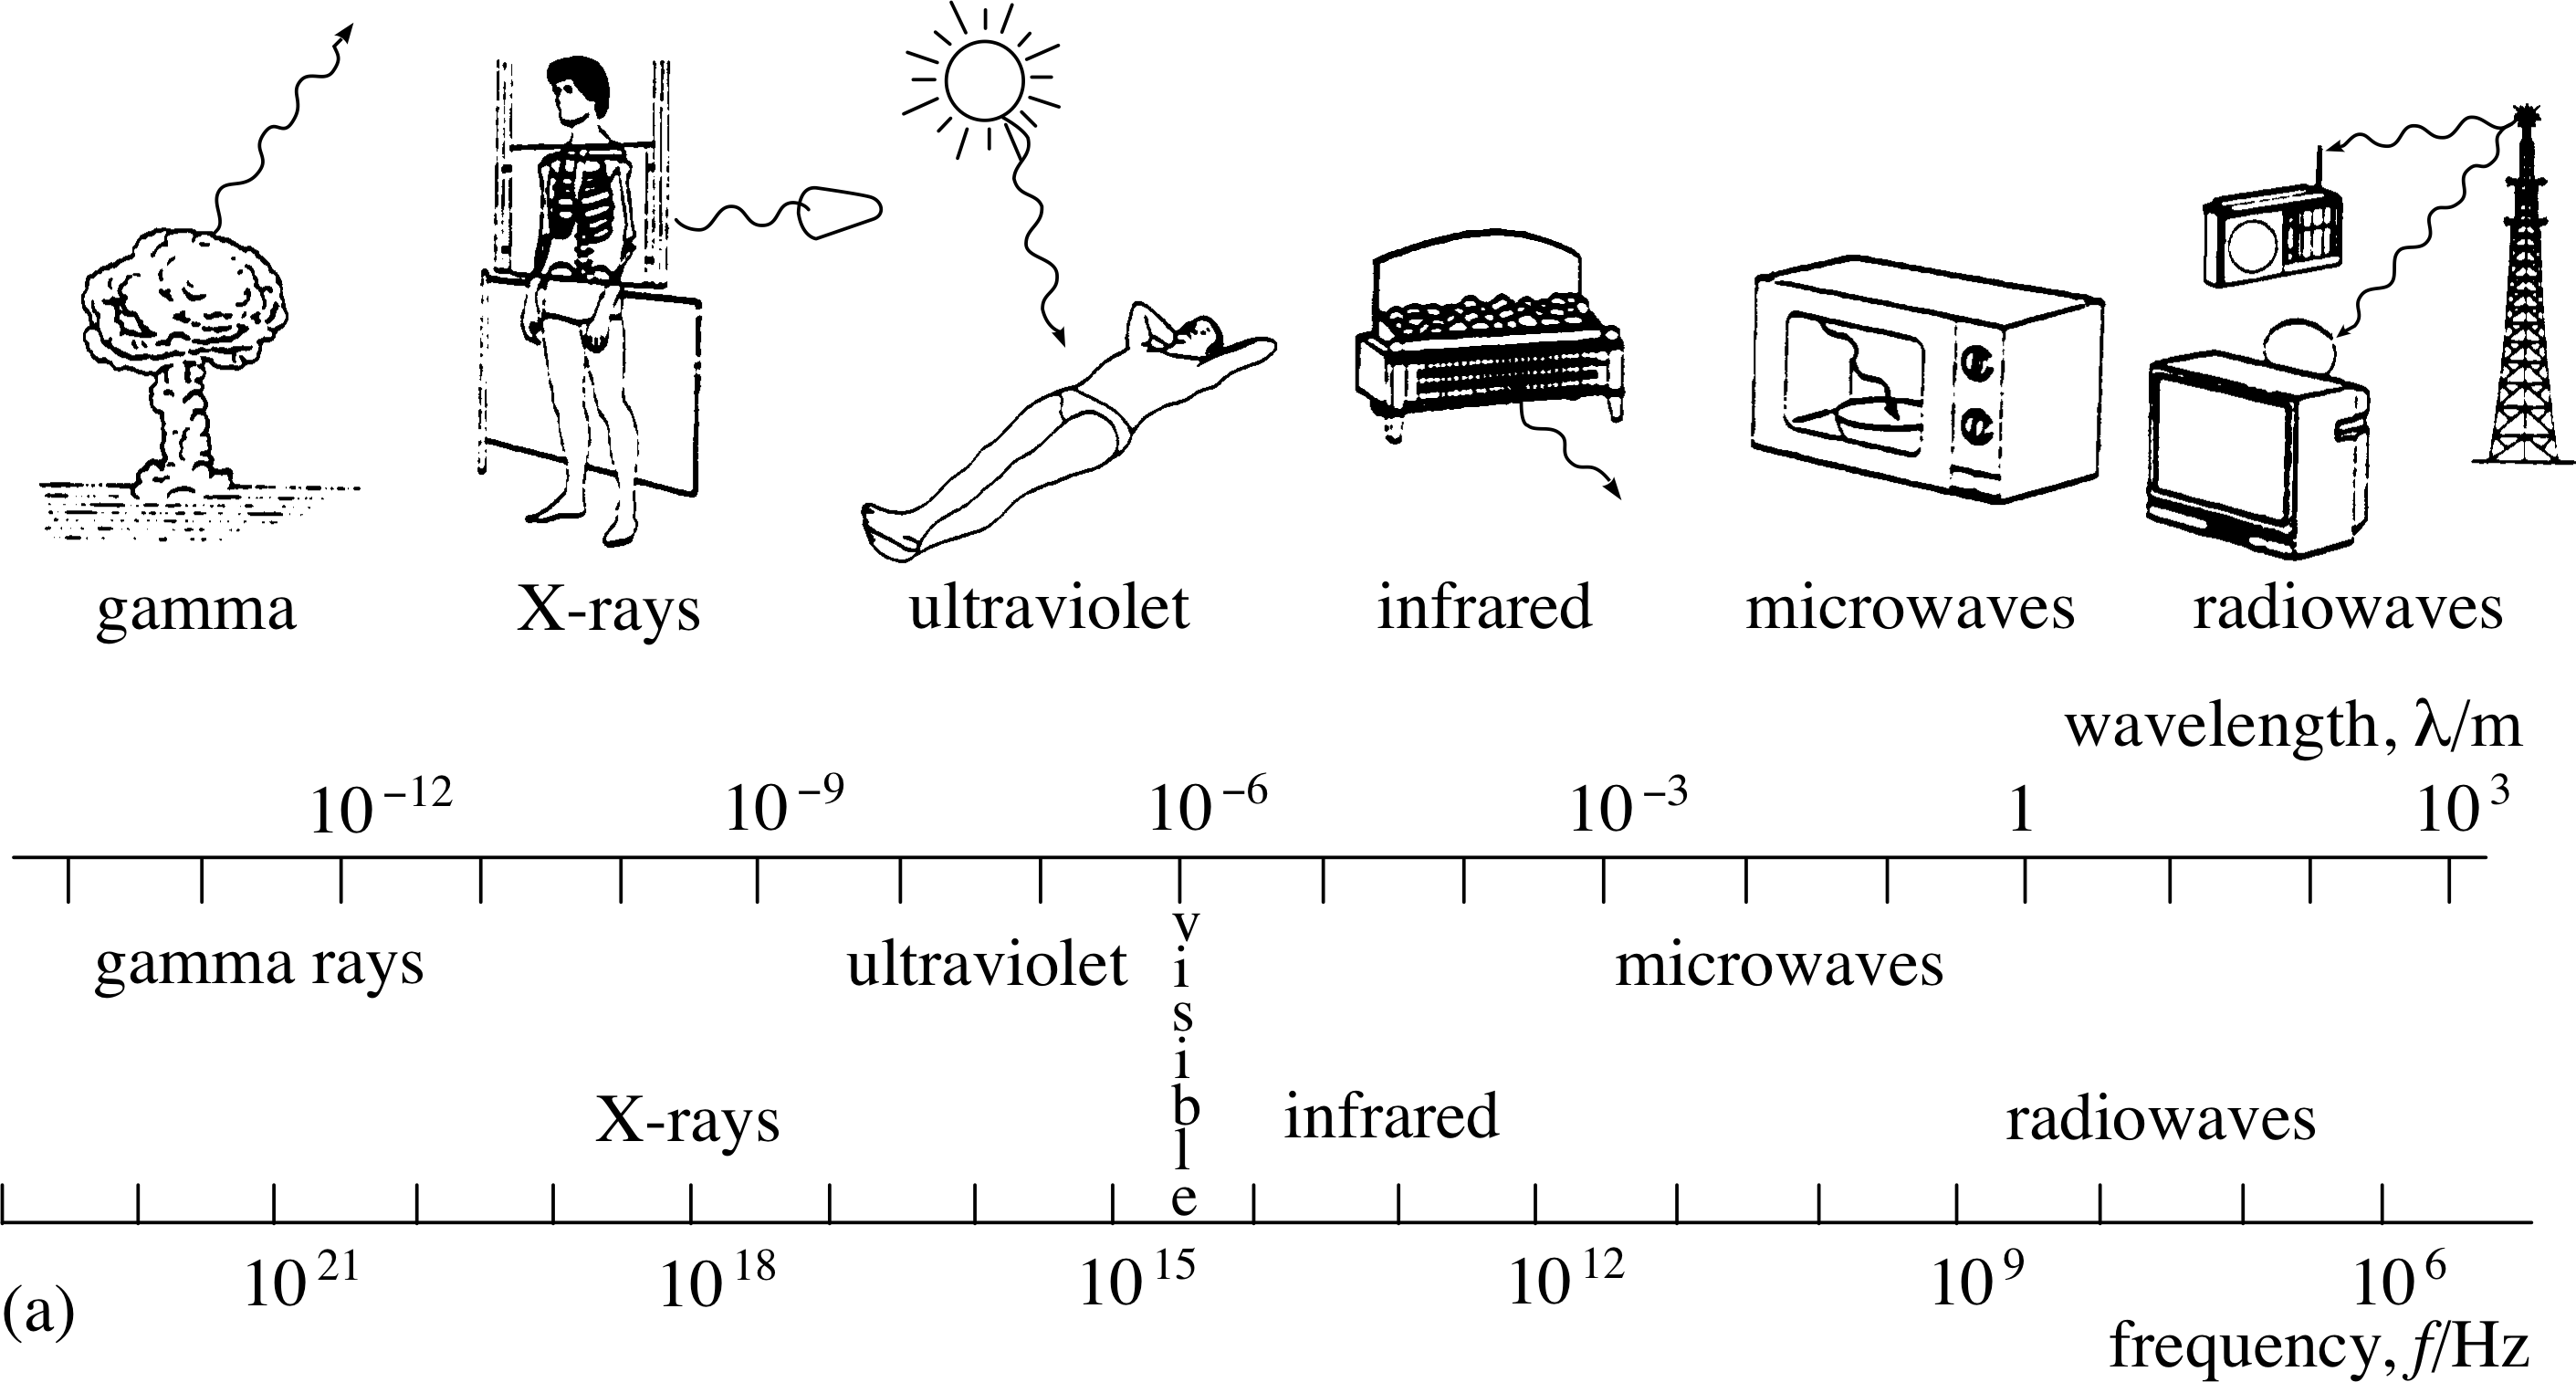
Figure 2a The electromagnetic spectrum.
Those parts of the spectrum with shorter wavelengths than visible light are notorious for their powers of penetration and their potential for causing biological damage. They include the gamma rays associated with nuclear phenomena, the X–rays used in hospitals and the ultraviolet radiation associated with a good sun–tan or a bad skin cancer.
On the other side of visible radiation, at the long wavelength end of the spectrum, are the more benign regions of infrared and microwave radiation that assist us in cooking, and the radiowaves that provide us with entertainment and worldwide communications.
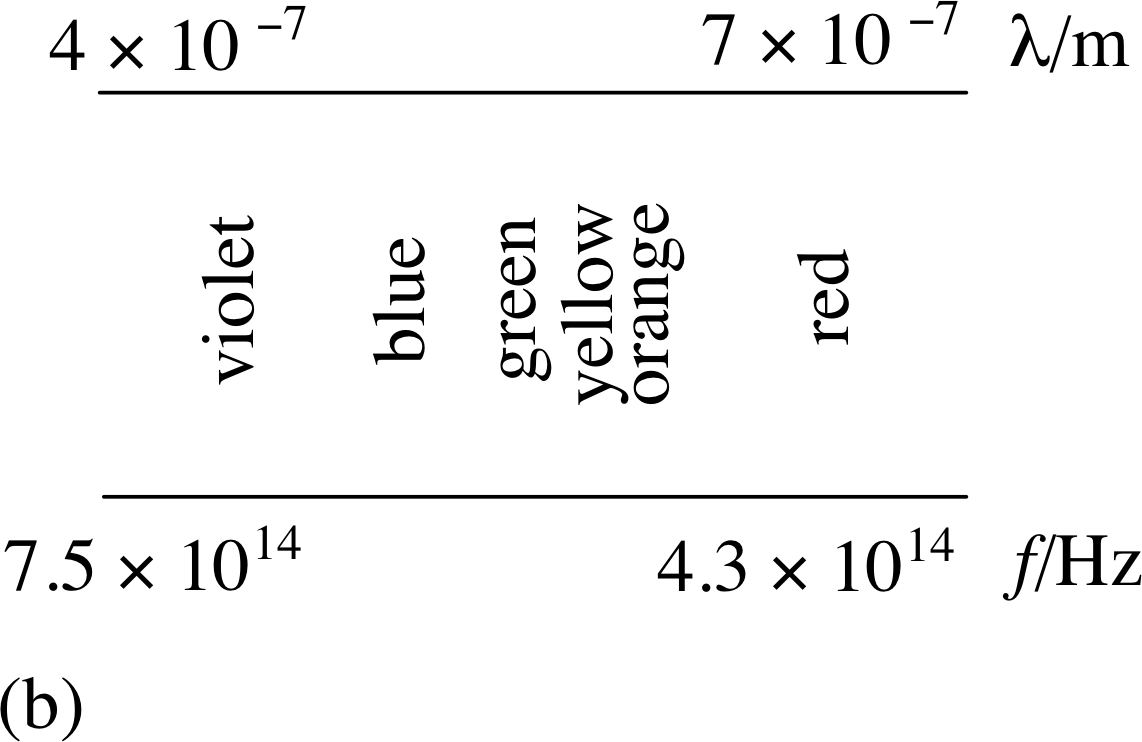
Figure 2b The part of the electromagnetic spectrum corresponding to visible light.
Notice that the wavelength and frequency scales in Figure 2a are logarithmic (i.e. they involve powers of ten) so the range covered by visible light (shown expanded in Figure 2b) really is very narrow indeed.
The human eye senses different frequencies of light as different colours. We usually define the colours by the corresponding wavelengths in vacuum and the sensible unit to use is the nanometre (1 nm = 10−19 m). Light in the range 400–500 nm is usually perceived as ‘blue’, 500–560 nm as ‘green’, 560–600 nm as ‘yellow’ and 600–750 nm as ‘red’. You may be aware that the eye is most sensitive to small wavelength changes as colour differences in the centre of the visible range, at around 550 nm; the trained eye can see a colour difference corresponding to a 10 nm change at around 550 nm but few can do this at around 650 nm. Evolution has equipped us with an eye which is perfectly tuned to sunlight! i
Question T1
Hertz measured the frequency of his electromagnetic waves to be 100 MHz. Calculate the wavelength of the radiation he generated.
Answer T1
From c = f λ we have:
$\lambda = \dfrac cf = \rm \dfrac{3.00\times10^8\,m\,s^{-1}}{100\times10^6\,s^{-1}} = 3.00\,m$
2.2 Polarization
For any electromagnetic wave the E and B vectors at any point must always be mutually perpendicular and must always lie in a plane which is perpendicular to the direction of propagation. Figure 1 illustrated a simple example in which the electric field vector E was confined to oscillate only in the x–direction and the magnetic field vector B only in the y–direction, but more complicated arrangements are also possible.
For instance, it is easy to imagine a wave travelling in the z–direction in which the E and B vectors are mutually perpendicular and confined to the (x, y) plane, but in which their orientation within that plane changes continuously along the z–axis. In such a wave the electric and magnetic fields would wind around the direction of propagation and, in contrast to Figure 1, there would be no unique direction associated with either field.
An electromagnetic wave that does have a unique direction associated with its electric field vector is said to be linearly polarized or plane polarized. For such a wave:
The plane of polarization is the plane that contains the direction of the electric field vector and the direction of propagation.
Figure 1 An instantaneous snapshot showing the varying magnitude and direction of the electric field E and magnetic field B at points along the path of the simplest kind of electromagnetic wave.
✦ What is the plane of polarization of the wave in Figure 1?
✧ The (x, z) plane.
Linearly polarized light is very special and rather artificial. Light from ordinary sources is more likely to be unpolarized; this means that the direction of the electric field within the plane perpendicular to the direction of propagation varies rapidly and unpredictably (usually over a time interval of the order of 10−9 s), and in such a way that on average there is no preferred direction of oscillation for the electric field. Processes such as reflection can cause unpolarized light to become polarized, so much of the light we see in everyday life is actually partially polarized – there is a preferred direction of oscillation for E but it is not as pronounced as it would be in the case of linearly polarized light. However, in any light wave, whatever its state of polarization, the instantaneous electric and magnetic fields are always perpendicular to each other and to the direction of propagation.
It is possible to produce linearly polarized light by passing a beam of unpolarized light through a polarizing filter or polaroid. These filters are often made by aligning certain long–chain molecules in one direction within a plastic sheet. This arrangement will preferentially absorb those light waves in which the electric field is oscillating parallel to the axis of alignment. Light emerging from a polarizing filter will then be polarized perpendicular to the aligned molecules. In polaroid sunglasses such filters are mounted so as to absorb light which is horizontally polarized; the light reflected from horizontal surfaces is partially polarized in this direction so polaroid sunglasses can reduce the glare from roads and swimming pools by preferentially removing this component of the light.
Question T2
A certain beam of partially polarized light is composed of equal amounts of vertically polarized light (with electric field amplitude E0) and unpolarized light. In what direction is the beam polarized and what will be the average electric field measured over a period of a few seconds? (Think carefully!)
Answer T2
The beam will be partially polarized in the vertical direction. However, the average electric field will be zero since any oscillating field reverses direction halfway through each period.
(This is one of the reasons why it is necessary to characterize a wave in terms of its (positive) amplitude rather than the average electric field.)
2.3 Light in materials
Now we will consider the nature of light in different (transparent) materials. When an electromagnetic wave travels through a transparent material its speed i is always less than c (the speed in a vacuum). For light travelling through air the difference is only 0.03% but the speed of light in glass or water is about two–thirds or three–quarters of c, respectively. We define the ratio of the speed of light in a vacuum to the speed of light in a material to be the refractive index of the material. The refractive index is usually represented by μ (the Greek letter ‘mu’), so:
$\mu = \dfrac{\text{speed of light in a vacuum}}{\text{speed of light in the material}}$(1)
| Material | Speed /108m s−1 | Refractive index |
|---|---|---|
| air | 3.00 | 1.00* |
| water | 2.26 | 1.33 |
| glass† | 1.6 to 2.0 | 1.9 to 1.5 |
| diamond | 1.24 | 2.42 |
|
* 1.0003 is a more accurate value for air. |
||
The speed of visible light and the corresponding refractive index for various common materials is given in Table 1.
For any given material, μ is found to vary with the wavelength of the light; different wavelengths travel at different speeds. Thus, the refractive indices in Table 1 are really averages taken over a range of wavelengths, though the variations are rather small. Other optical properties of materials vary even more strikingly with wavelength. Some materials are transparent at one wavelength and opaque at another.
When light passes from one material into another, its speed usually changes. Since the speed is always given by the product of the wavelength and the frequency, it is interesting to ask whether it is the wavelength or the frequency which changes, or do both change?
To answer this, consider what happens at the boundary of the two materials. The fields on both sides of this boundary must oscillate in the same way, so they must have a common frequency. The wavelength and speed of light may vary across the boundary, but the frequency must remain the same.
$\lambda_{\rm material} = \dfrac{\lambda_{\rm vacuum}}{\mu}$(2)
Question T3
The refractive index μ of a glass block is 1.50 for light of frequency 6.00 × 10¹⁴ Hz. Find the wavelength of the light in a vacuum and inside the block.
Answer T3
In a vacuum c = f λ and therefore
$\lambda = \rm \dfrac{3.00\times10^8\,m\,s^{-1}}{6.00\times10^{14}\,s^{-1}} = 5.00\times10^{-7}\,m = 500\,nm$
In the block υ = c/μ therefore
υ = 3.00 × 10⁸ m s−1/1.50 = 2.00 × 10⁸ m s−1
$\lambda_{\rm block} = \dfrac{\upsilon}{f} = \rm \dfrac{2.00\times10^8\,m\,s^{-1}}{6.00\times10^{14}\,s^{-1}} = 333\,nm$
Alternatively,
$\lambda_{\rm block} = \dfrac{\lambda_{\rm vacuum}}{\mu} = \rm \dfrac{500\,nm}{1.50} = 333\,nm$
3 Propagation and Huygens’ principle
3.1 The propagation of an unrestricted wavefront
The electromagnetic wave model introduced in Section 2 can provide a complete account of the propagation of light that includes details of its behaviour at surfaces which reflect or transmit the light that falls upon them. However, the full theory is mathematically complicated and rather cumbersome. Fortunately it is possible to obtain a good deal of insight into the propagation of light by means of a much simpler approach introduced in the 17th century by the Dutch physicist Christiaan Huygens.
In its modern version, Huygens’ approach makes use of wavefronts. In a region occupied by waves, a wavefront is a line (in two dimensions) or a surface (in three dimensions) that only passes through points at which the wave is at the same stage (or phase) in its oscillatory cycle. For instance, in the case of the waves spreading out from a point of disturbance on the surface of a pond, the wavefronts would be concentric circles that might, for example, run along the crests (or troughs) of the waves at some instant. These circular wavefronts would expand outwards, along with the waves until some obstruction was encountered. In the absence of such restrictions the wavefront through any point will be perpendicular to the direction of propagation of the wave at that point.
Note In this module we will often use lines or curves to represent wavefront surfaces in three dimensions. We can safely do this when there is an obvious symmetry in the situation. For example, in the case of waves expanding outwards uniformly from a point in three–dimensional space, the wavefronts will be spherical surfaces centred on the source point but, thanks to the spherical symmetry, they can safely be indicated diagramatically by circles drawn around the source point. Also note that when using wavefronts it is usual to draw them at intervals of one wavelength. Thus, if one wavefront passes only through points at which the wave is reaching its maximum, the next wavefront will normally have the same property.
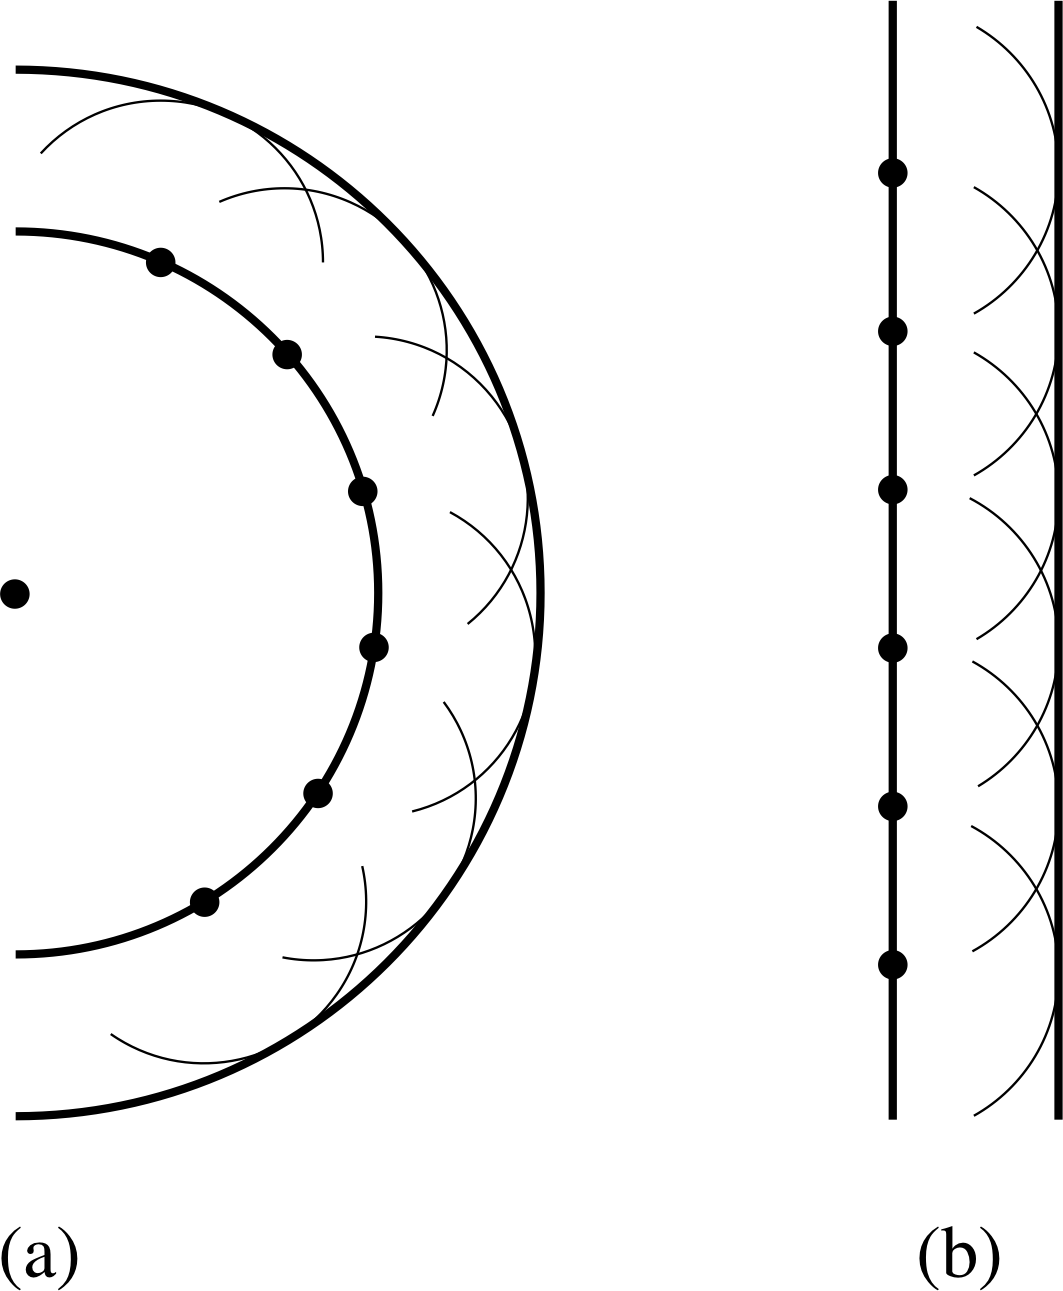
Figure 3 The Huygens’ constructions for an unrestricted wavefront (shown in two dimensions) in the case of (a) a spherical wavefront and (b) a plane wavefront.
Huygens realized that it is possible to predict how a given wavefront will advance by means of geometrical constructions similar to those of Figure 3. These constructions are based on the following principle:
Huygens’ principle:
Each point on a wavefront may be treated as a source of secondary wavelets that expand radially from their source with the same speed as the original wave.
In practice it is only necessary to select as sources a set of points that are separated by about one wavelength. After a short period of time (typically about the period of the wave) the new wavefront can be constructed by drawing a smooth line that just touches each wavelet.
Figure 3 shows how this works for a wave expanding from a point source in three dimensions when the wavefront is unrestricted. In Figure 3a we are looking near the source, and the time interval for the construction is the wave period, so a circular (i.e. spherical) wavefront creates a new circular (i.e. spherical) wavefront that has expanded by one wavelength.
In Figure 3b we are looking at the situation far away from the source; now the radii of the wavefronts are so large that any small part of the wavefront will appear to be a flat plane and will give rise to other planes as it advances.
Note A point source is ideally one of zero size. A real source acts as a point source when its size is less than a wavelength of light. In practice a source can often be treated as a point source if the distance to the source is very large compared to the size of the source.
Thus, Figure 3a depicts an expanding spherical wave with spherical wavefronts and Figure 3b a plane wave with plane wavefronts. At sufficiently large distances from a point source any expanding spherical wave approximates a plane wave, as the radius of curvature of the wavefronts become very large.
3.2 The propagation of a restricted wavefront – diffraction i
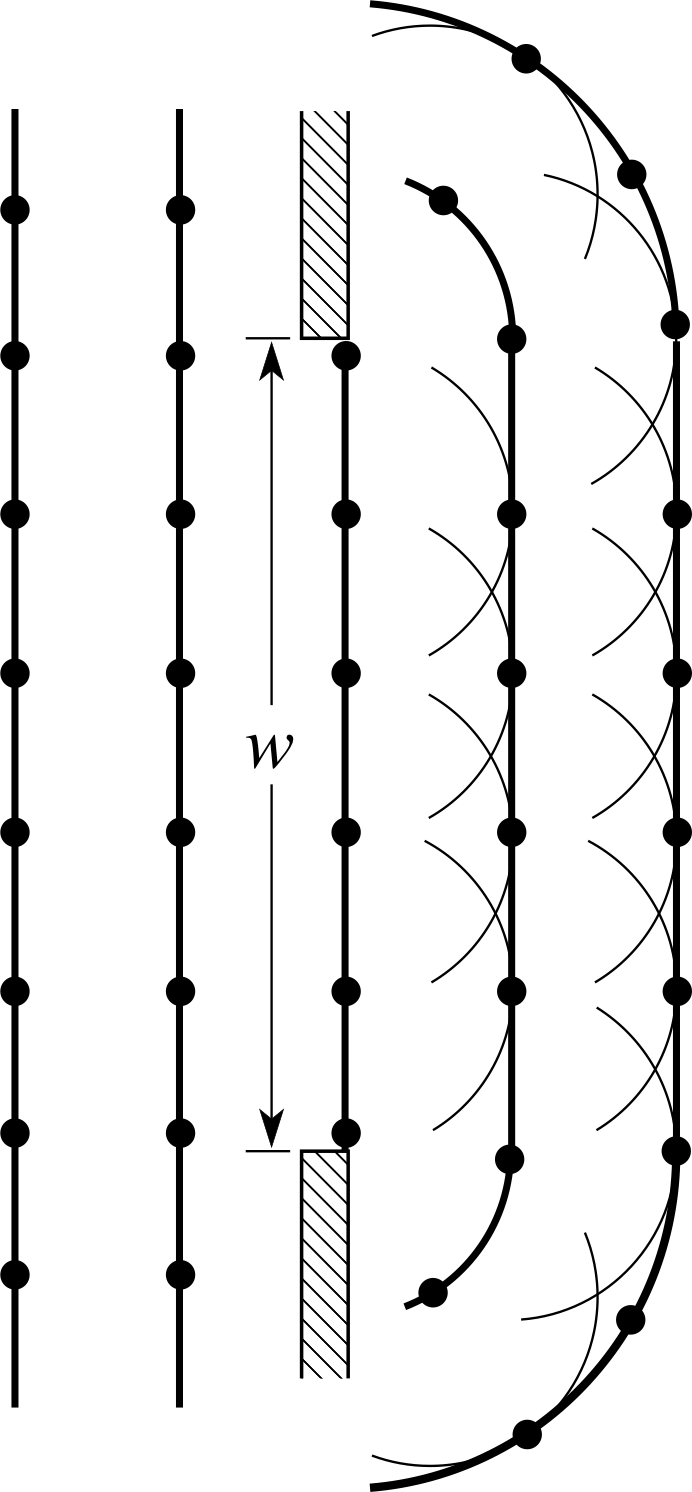
Figure 4 The Huygens’ construction for diffraction at an aperture of width equal to five wavelengths.
Figure 4 shows a plane wavefront propagating to the right, through an aperture. In this case the aperture is a slit of width w, where w happens to be five times the wavelength of the light. This aperture represents a significant restriction to the passage of the wavefront since its width is comparable to the wavelength. In using Huygens’ construction to determine the form of the wavefront to the right of the slit we must include only those secondary wavelets originating from points within the aperture since all the others are blocked off by the slit walls. The striking feature of the resulting wavefront, shown in Figure 4, is that near the edges of the slit the wavefronts are curved, corresponding to waves moving away from the original direction of propagation. The curvature arises as a result of the missing contributions which are now blocked off by the walls of the slit. The inescapable conclusion is that the beam, which initially was travelling parallel to the axis, has been spread out by the restriction imposed by the slit. This spreading effect is known as diffraction.
Note You may be wondering why, in the Huygens’ construction, we only consider the expanding secondary wavelets travelling in the direction of the original wave, rather than also in the opposite direction. If so, you deserve congratulations! This is one of the flaws in the Huygens’ approach and it needs Maxwell’s theory to resolve it.
The extent to which light is diffracted by a slit depends on the size of the slit. If the slit width is very large compared to the wavelength then the diffraction effect is rather insignificant, unless we look very close to the shadow region near the edge of the slit. On the other hand, if the slit width is made narrower than five wavelengths, the diffraction becomes more significant. If the slit width were less than one wavelength then it would act essentially as a line of point sources with circular wavefronts beyond the slit, corresponding to the beam having been spread out uniformly over all angles. The diffraction of light by narrow apertures is a striking phenomenon and provides a strong indication that light is a wave phenomenon. i
Home experiment If you have access to a pair of binoculars, mask one of the large front lenses using card to produce a narrow slit about 1 mm wide. Look through the eyepiece and focus on a distant street lamp at night. You should see a wider image of the slit and several subsidiary images – the former effect is clear evidence of diffraction, the latter is explained in Subsection 5.6.
Diffraction has been described as a consequence of restricting an infinite wavefront by interposing a narrow aperture. Alternatively we could have demonstrated diffraction by placing a narrow obstacle in front of the infinite wavefront. Either a hair or a narrow slit is an equally suitable object with which to produce diffraction from an infinite wavefront.
Diffraction is the spreading of a propagating wavefront away from its original direction of propagation that occurs whenever the wavefront encounters an aperture or an obstacle. The effects are especially significant when they are caused by an object whose size is comparable with the wavelength of light.
✦ In terms of Huygens’ principle the diffraction of plane waves by a narrow slit can be attributed to the absence of the secondary wavelets from points outside the slit. How can you explain the diffraction of light by a hair?
✧ In the case of the hair it is the secondary wavelets from the points occupied by the hair that are absent.
3.3 Propagating wavefronts and rays of light
Before going on to discuss reflection and refraction we will introduce the convenient concept of a ray of light. Light rays are directed lines (i.e. they have arrowheads on them) used to show the direction in which the light is propagating. They are drawn at right angles to propagating wavefronts. In our example of the spherical wave the light rays are straight lines spreading radially from the source, and in the case of the plane wave they are straight parallel lines, perpendicular to the wavefronts.
In any uniform medium, rays travel in straight lines and it is very convenient to use rays to track the passage of light through a system – but we must remember that we are dealing with a wave phenomenon, that the rays represent propagating wavefronts and that diffraction will spread the beam when restrictions (apertures or obstacles) are involved. Apertures are always involved to some extent since we can never work with an infinite wavefront! Therefore, we should really draw our rays not as sharp lines but as ‘bands’ of increasing width, as the wavefronts spread out. In fact this is never done on ray diagrams and the convention is rather that ray diagrams are not used where diffraction effects are significant. Fortunately there are many cases where the apertures involved are much greater than the wavelength, so the diffraction effects are insignificant and we can safely represent the passage of light by rays. The range of topics that can be adequately treated by methods based on the use of rays constitutes the field of geometrical optics, and the territory where rays are inadequate and a fuller version of the wave model must be used constitutes physical optics.
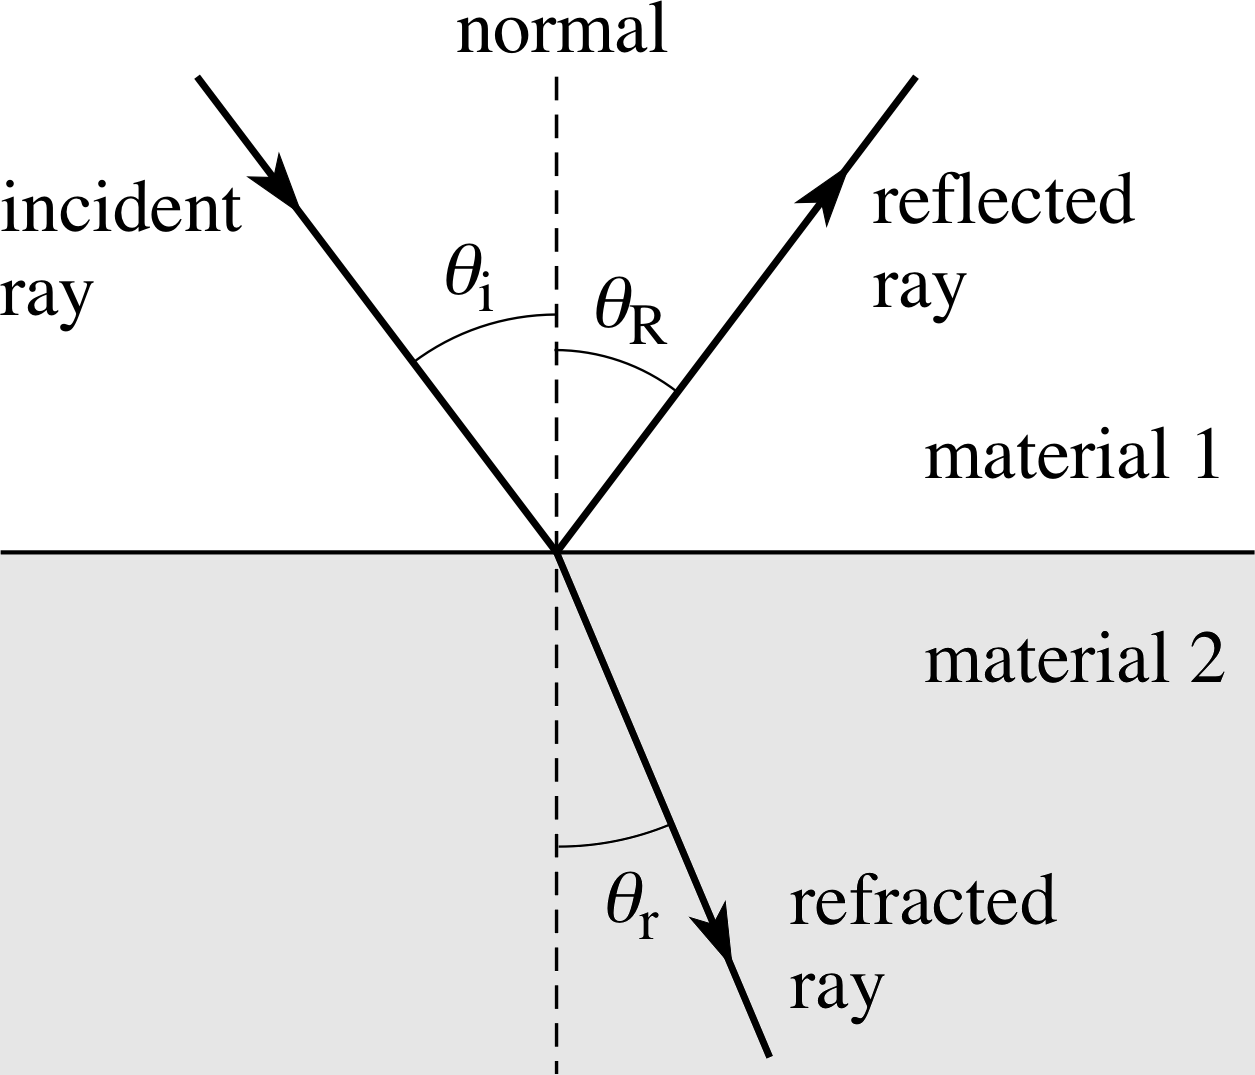
Figure 6 Experimental observation of the reflection and refraction of a light ray at the boundary between two transparent materials.
3.4 The reflection of light
Huygens’ principle can easily explain the behaviour of light when it is reflected from a plane mirror. A plane mirror is a flat reflecting surface, on which any irregularities are much less than a wavelength of light. Such mirrors are often made by depositing a silver film on to a flat glass surface. In this situation we can represent light arriving at the mirror from some particular direction by means of an incoming ray, called the incident ray. The direction of this ray can be specified by defining a line called the normal that is perpendicular to the mirror’s surface at the point of incidence, and assigning a value to the angle of incidence θi between this normal and the incident ray. Similarly, the direction of the light reflected from the point of incidence can be indicated by a reflected ray and specified by the angle of reflection θr between the normal and the reflected ray. These angles are shown in Figure 6.
Experiments support the following:
Law of reflection
- The reflected ray, the incident ray and the normal all lie in the same plane.
- The angle of reflection is always equal to the angle of incidence: θR = θi
Figure 5 The reflection of a wavefront. Note that the angles marked θi and θr are not themselves the angles of incidence and reflection, but they are equal to those angles.
The Huygens’ construction that accounts for this is shown in Figure 5. The line ABC is part of an extensive plane wavefront (where AC ≫ λ), moving in the direction shown by the arrows and beginning to arrive at the plane mirror at an angle of incidence θi. Point A on the wavefront is just arriving at the mirror. Points on the wavefront corresponding to B and C will arrive later, at points N and C′ on the mirror. Secondary wavelets produced at the same time from points A, B and C will expand outwards from these points, all travelling at the same speed. In the time taken for the wavelet produced at C to reach the mirror at point C′, the wavelet from A will have covered an equal distance and will be arriving at A′ while that from B will be arriving at B′ having also covered the same distance (BN + NB′).
The resulting wavefront, after reflection at the mirror, will be the line A′B′C′ that is tangential to each of the wavelets. Now, the right–angled triangles ACC′ and AA′C′ are identical, so the lines ABC and A′B′C′ make the same angle with the mirror surface. Since the light rays are perpendicular to the wavefronts it follows that these angles are also equal to the angles of incidence θi and reflection θr, respectively, so these two angles are equal – in accord with observation.
Question T4
Using a ruler, compasses and protractor construct a diagram similar to Figure 5 but with the angle CA^C′ = 20°. What is the angle of reflection on your figure?
Answer T4
You should find that the angle of reflection is 20°, equal to the angle of incidence.
Figure 6 Experimental observation of the reflection and refraction of a light ray at the boundary between two transparent materials.
3.5 The refraction of light
If you place a pencil into a glass of water, you will observe that the pencil appears to be bent at the surface of the water. This effect is due to the refraction of light rays at the air–water surface. In general, when a light ray passes from one transparent material into another there will be both a reflected ray and a refracted ray which passes into the second material, having been bent or refracted at the surface. This is illustrated in Figure 6. The direction of the refracted ray can be specified by the angle of refraction θr between the refracted ray and the normal drawn in the second material.
Experiments support the following:
Law of refraction
- The incident ray, the refracted ray and the normal all lie in the same plane.
- The angle of incidence and the angle of refraction are related by
$\dfrac{\sin\theta_{\rm i}}{\sin\theta_{\rm r}} = \rm constant$(3) i
where the constant depends on the two materials involved and on the wavelength of the light.
We can use the Huygens’ construction to explain these observations. The argument follows closely along the lines used in Subsection 3.4.
Figure 7 The refraction of a wavefront (reflection not shown). Note that the angles marked θi and θr are not themselves the angles of incidence and refraction, but they are equal to those angles.
In Figure 7 ABC is part of an extensive plane wavefront (where AC ≫ λ), moving in the direction shown by the arrows and beginning to arrive at the boundary between the two materials. It is now possible for light to travel in either material, though if the materials have different refractive indices, μ1 and μ2 say, the light must change speed as it moves from one material to the other. Let us suppose that in material 1 the speed of light is υ1 = c/μ1 and that in material 2 it is υ2 = c /μ2. Now, consider what happens to secondary wavelets emitted simultaneously from points A, B and C on the incident wavefront.
In the time taken for the wavelet from C to travel at speed υ1 through material 1 to the point C′, the wavelet from A will have travelled at speed υ2 through material 2 to A′ and the wavelet from B will have travelled first with speed υ1 to B′′ and then at speed υ2 to B′. (Figure 7 shows this for the situation where υ2 < υ1, (i.e. μ2 > μ1) but we could equally well have dealt with the case where υ2 > υ1). As usual the propagated wavefront is tangential to the secondary wavelets, so in this case it is the line A′B′C′. As you can see this new wavefront is not parallel to the original wavefront ABC – the waves have been refracted. We can find the relationship between the angles θi and θr by equating the time required for the wavelet in material 1 to cover the distance CC′ with the time required for the wavelet in material 2 to cover the distance AA′, recalling that the wavelets travel at different speeds we obtain:
$\dfrac{\rm CC'}{c/\mu_1} = \dfrac{\rm AA'}{c/\mu_2}$ i
i.e.$\dfrac{\rm CC'}{AA'} = \dfrac{\mu_2}{\mu_1}$
The triangles AC^C′ and AA^′C′ are both right–angle triangles, where the angle CA^C′ = θi and A′C^′A = θi, so we can use the trigonometric relations:
sin θi = CC′/AC′ sin θr = AA′/AC′ and sin θi /sin θr = CC′/AA′ to give :
$\dfrac{\sin\theta_{\rm i}}{\sin\theta_{\rm r}}= \dfrac{\mu_2}{\mu_1}$(4)
Equation 4 is now known as Snell’s law. It shows that the constant in Equation 3,
$\dfrac{\sin\theta_{\rm i}}{\sin\theta_{\rm r}} = \rm constant$(Eqn 3)
is just the ratio of the refractive indices of the two materials and thus explains why it depends on the materials themselves and on the wavelength of the light. This association of μ with refraction also explains why μ is called the refractive index. i
Question T5
Using a ruler, compasses and protractor, construct a diagram similar to Figure 7 but with θi = 20° (take μ1 = 1.0 and μ2 = 1.5). Find θr and compare it with the theoretical prediction from Snell’s law.
Answer T5
You should find from your diagram that the angle θr is about 13°. Snell’s law gives:
$\dfrac{\sin\theta_{\rm i}}{\sin\theta_{\rm r}} = \dfrac{\mu_2}{\mu_1}\quad\text{or}\quad\sin\theta_{\rm r} = \dfrac{\mu_1\sin\theta_{\rm i}}{\mu_2}$
therefore$\theta_{\rm r} = \arcsin\left(\dfrac{\sin20°}{1.50}\right) = 13.2°$
Your diagram should agree with this to within the accuracy of the drawing.
It is interesting to contrast the account of refraction given by Huygens’ wave model of light with that of Newton’s particle model. The particle model had to claim that particles of light were ‘attracted’ by the higher refractive index material so as to bend them towards the normal. The mechanism of this attraction was unknown but the consequence of the attraction would be an increase in the speed of light in the higher refractive index material. The wave model made exactly the opposite prediction, that the speed of light is reduced in the higher refractive index material. It is difficult to measure the speed of light and this issue was not settled until the mid-19th century, when the French physicist Jean Foucault (1819–1868) made a precise measurement of the speed of light in a vacuum and also in various transparent materials (see Table 1). This confirmed the prediction of the wave theory.
The variation of refractive index with wavelength leads to the phenomenon of dispersion, that is the variation of the speed of light in a transparent material with wavelength. Its occurrence implies that the angle through which a given incident ray is refracted by a particular material will generally depend on the wavelength. This effect was first used systematically by Isaac Newton when he employed a triangular glass prism to study the spectrum of colours which make up white light from the Sun. Sometimes the term dispersion is specifically used to describe the separation of a beam of light into its constituent wavelengths when it is refracted by a material whose refractive index depends on wavelength.
4 Illumination and the inverse square law
4.1 Intensity
As the warmth of sunlight proves, light can carry energy through space. The general study of the transfer of energy by light is very complicated; in this section we describe some simple cases and discuss the way in which the wave model accounts for the phenomenon of energy transfer by light.
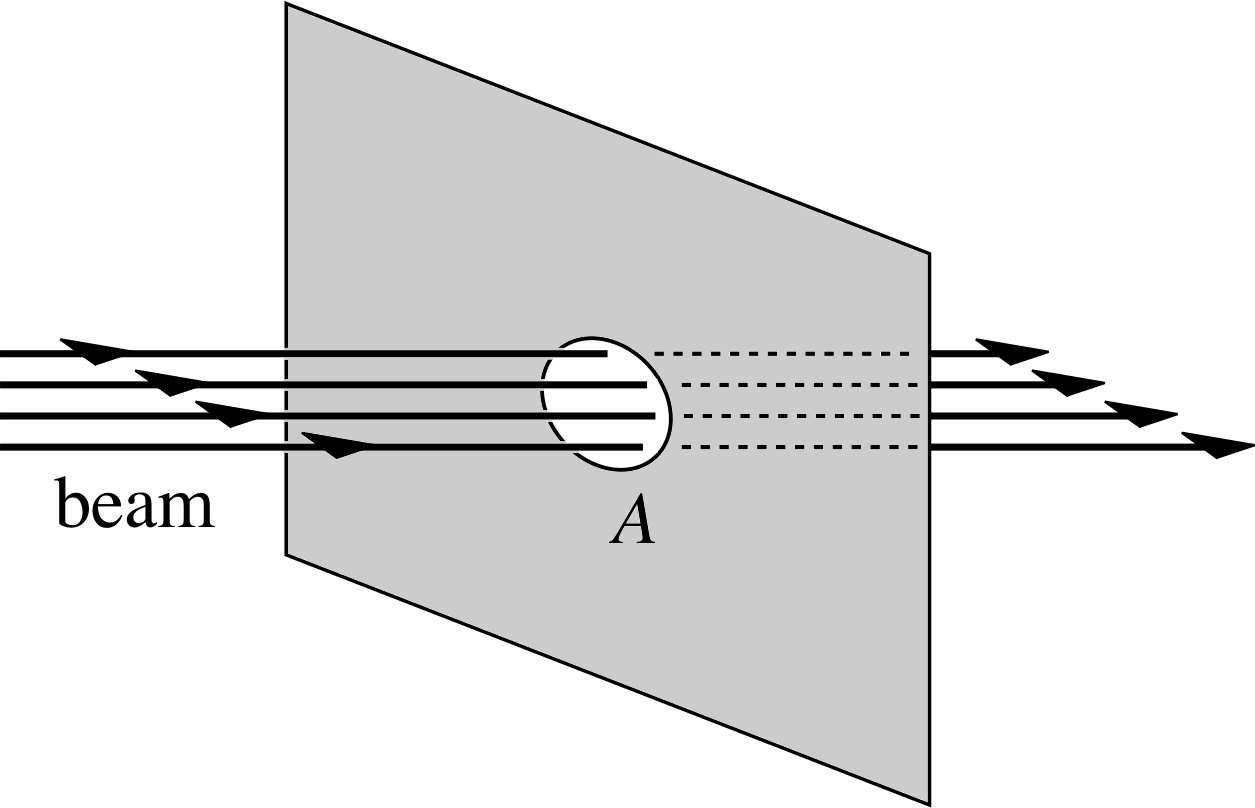
Figure 8 An idealized uniform parallel beam of light passing through area A of a plane perpendicular to the direction of propagation.
Figure 8 shows a plane drawn perpendicular to an idealized uniform parallel beam of light. If the rate at which the beam transfers energy across the area A is denoted by P (for power) i then the intensity of the beam passing through the plane is given by:
I = P/A(5)
According to the electromagnetic wave model of light, a uniform light beam of the kind shown in Figure 8 may be represented by a uniform plane wave, that is a plane wave in which the electric field has the same instantaneous magnitude E at all points on any given wavefront.
Remember, at any given point on the path of an electromagnetic wave the magnitude (and direction) of the electric field changes with time, varying between zero and E0 – the amplitude of the electric field. Now, according to the theory of electromagnetic waves, a uniform plane wave transfers energy in the direction of propagation at a rate that is proportional to the square of its electric field amplitude. Thus we may define the intensity of such a wave by:
I = kE02
where k is an appropriate constant of proportionality. The form of this relationship should not come as too much of a surprise to you since the energy of oscillating systems is often proportional to the square of the amplitude.
✦ If the above definition of the intensity of a uniform plane wave is to be consistent with the definition of the intensity of a uniform beam of light, what are suitable SI units for k?
✧ Equating the two expressions for I and rearranging gives us k = P/(AE2)
Consequently, the units of k should be W/(m2 V2 m−2) = W V−2 i
While it is convenient to define intensity in terms of the idealized situation shown in Figure 8, in all real cases a beam is never perfectly parallel nor perfectly uniform; it always diverges to some extent, and its intensity varies over its cross section. An important practical light source that at least approximates the idealized case is the laser. The beam from a laser is very nearly parallel, though its intensity is not uniform over the cross section. The finite width of the beam implies that it must spread a little due to diffraction since it behaves as though diffracted by an aperture of width equal to the diameter of the beam – the narrower the beam the more it spreads. A small helium–neon laser (which has a red beam) might typically radiate 1 mW of power in a 1 mm diameter beam, the edges of which diverge from one another at an angle of only one milliradian.
Question T6
Use the figures given above to calculate the average intensity of this laser (a) at the laser itself and (b) at a distance of 100 m from the laser. In (b) you may assume that the laser acts as a point source, but with the full divergence given above.
Answer T6
You should use I = P/A, with P = 10−3 W.
(a) At the laser, the area A of the beam of diameter d is A = πd2/4. With d = 10−3 m this becomes:
A = π × 10−6 m2/4 = 7.85 × 10⁻⁷ m2
So intensity
I = P/A = 10−3 W/7.85 × 10−7 m2 = 1.27 kW m−2
(b) With a full beam divergence θ at a distance l from the laser, the beam diameter D is given by:
D = lθ = 100 m × 10−3 rad = 10−1 m
and the new area of the beam is A′ = πD2/4 = 7.85 × 10⁻³ m2
The intensity at 100 m is
I′ = P/A′ = 10−3 W/(7.85 × 10−3 m2) = 0.127 W m−2
4.2 The inverse square law of illumination
Real light sources produce a diverging beam for which the intensity (i.e. the rate at which energy is transferred across a unit area perpendicular to the direction of propagation) must decrease with distance from the source. It is often important to know the intensity of a beam at its point of arrival but to predict this we need to know how the intensity decreases with distance from the source. For the idealized case of a perfectly parallel beam the answer is that the intensity is independent of the distance, but such a case never occurs in practice – even the laser has an intensity which decreases with distance, as you saw in Question T6.
Fortunately, we can predict how the intensity will decrease with distance for the idealized case of a point source radiating uniformly in all directions, producing spherical waves and spherical wavefronts. This is often a very good approximation to real sources, particularly at distances much greater than the size of the source. i
Consider a point source (located in a vacuum) that consumes power P and radiates all of that power, uniformly in all directions, at visible wavelengths. Suppose that the source is at the centre of an imaginary sphere of radius r. The rate at which energy flows across the whole imaginary spherical surface must also be P and since this power is spread uniformly across the surface each part of the sphere will receive the same power per unit area.
This power per unit area on the surface is the intensity at the surface and, since the surface area of the sphere is 4πr2, it must be given by
$I(r) = \dfrac{P}{4\pi r^2}$(6)
Equation 6 shows that the intensity due to a uniformly radiating point source decreases as the inverse square of the distance from the source. This is known as the inverse square law of illumination. In deriving this we have relied only on the principle of conservation_of_energyenergy conservation and on the geometry of a sphere. The inverse square law also holds in the case of a spherical source of any size, providing it radiates uniformly in all directions and provided the distance r (measured from the centre of the sphere) is much larger than the radius of the source.
Question T7
On a clear dark night an average person can just see the light from a 40 W tungsten bulb at a distance of 30 km. Estimate the minimum intensity that the human eye can detect (remember the inefficiency of the tungsten bulb). Assuming the aperture (pupil) of the eye has radius 2 mm calculate the minimum power that the eye can detect. In terms of power suggest why a telescope increases the range of visibility.
Answer T7
From Subsection 4.2 we can assume that 20% of the power of the bulb (i.e. 8 W) is radiated as light. The intensity at 30 km is then given by Equation 6,
$I(r) = \dfrac{P}{4\pi r^2}$(Eqn 6)
as$\rm \dfrac{8.0\,W}{4\pi\times(3.0\times10^4\,m)^2} = 7.1\times10^{-10}\,W\,m^{-2}$
We take this as an estimate of the minimum visible intensity Imin. Given the radius of the eye pupil as 2 mm, the minimum optical power into the eye which can be detected by the eye is
Pmin = Imin × Apupil = 7.1 × 10⁻¹⁰ W m−2 × π × (2 × 10⁻³ m)2 = 9 × 10⁻¹⁵ W
A telescope improves visibility because it collects more light from its much larger aperture and directs this into the eye.
Question T8
Taking the intensity of sunlight as 1.4 kW m−2 at the Earth’s orbital distance (1.5 × 10¹¹ m), estimate the total power transferred into space from the Sun by sunlight.
Answer T8
From Equation 6,
$I(r) = \dfrac{P}{4\pi r^2}$(Eqn 6)
P = 4πr2I = 4π (1.5 × 10¹¹ m)2 × 1.4 × 103 W m−2 = 4 × 1026 W
As a consequence of geometry and conservation, inverse square laws arise in many areas other than illumination. For example, gamma radiation from small radioactive sources is emitted uniformly in all directions so the intensity of the radiation decreases as the inverse square of the distance from the source. A person standing at a distance of 10 m from a source will receive a radiation dose 1% of that received by a person 1 m away, over the same time interval. (This calculation neglects the small absorption of gamma radiation by the air.) The inverse square law is the best and most reliable radiation shield we have!
5 Interference and the superposition principle
In Subsection 3.2 we described diffraction and explained that this strongly indicates that light travels as a wave. In this section we describe interference, which provides even clearer evidence of wave–like behaviour.
If two beams of light of equal intensity come together at a point in space, what will be the intensity at the intersection point? If the beams are thought of as streams of particles, each carrying its own small share of the energy, the expected answer is obvious. The intensity must be twice the intensity of each beam alone, since the total number of particles will be equal to the sum of the numbers in each beam – it’s as easy as ‘1 + 1 = 2’. However, experimentally it is found that under the right circumstances the resulting light intensity can be anything from zero to four times the intensity of a single beam – the outcome depends critically on the source of the two beams and is not determined by their intensities alone. This extraordinary phenomenon, first demonstrated by Thomas Young in 1801, is easily explained by a wave model of light but is almost impossible to account for in terms of particles. Its discovery provided convincing evidence that light was a wave phenomenon even though many decades were to pass before Maxwell uncovered the electromagnetic nature of those waves.
5.1 The superposition principle
A property which is common to all waves, and which can be used to find their combined effect, is enshrined in the following principle.
principle_of_superpositionThe superposition principle
If two or more waves meet in a region of space, then at each instant of time the net disturbance they cause at any point is given by the sum of the disturbances caused by each of the waves individually. i
By ‘disturbance’ we mean the change in whatever physical quantity is marking the passage of the wave. For water waves it would be the vertical displacement of the wave from the normal water level; for sound waves it would be the change in air pressure from its undisturbed value; for light waves it would be the change in the transverse electric and magnetic fields at each point.
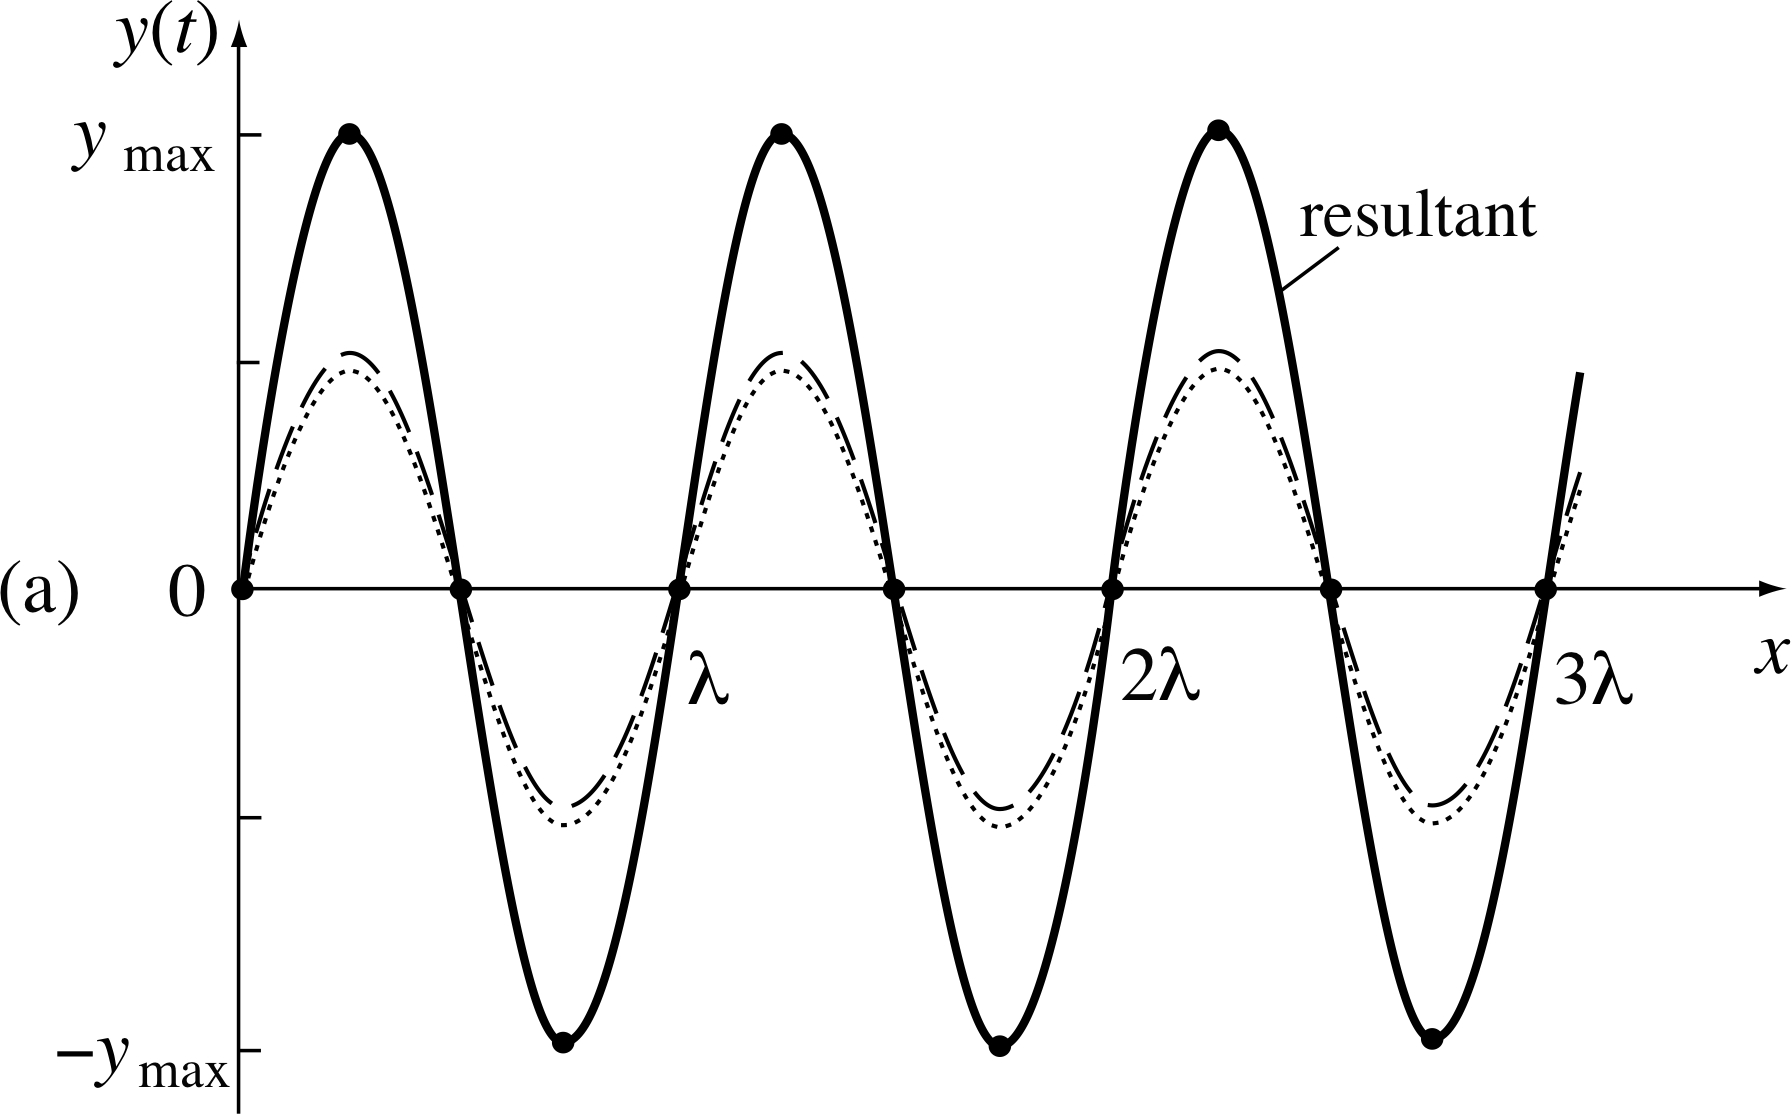
Figure 9a Superposition of two waves with both waves in step (zero phase difference or in phase)
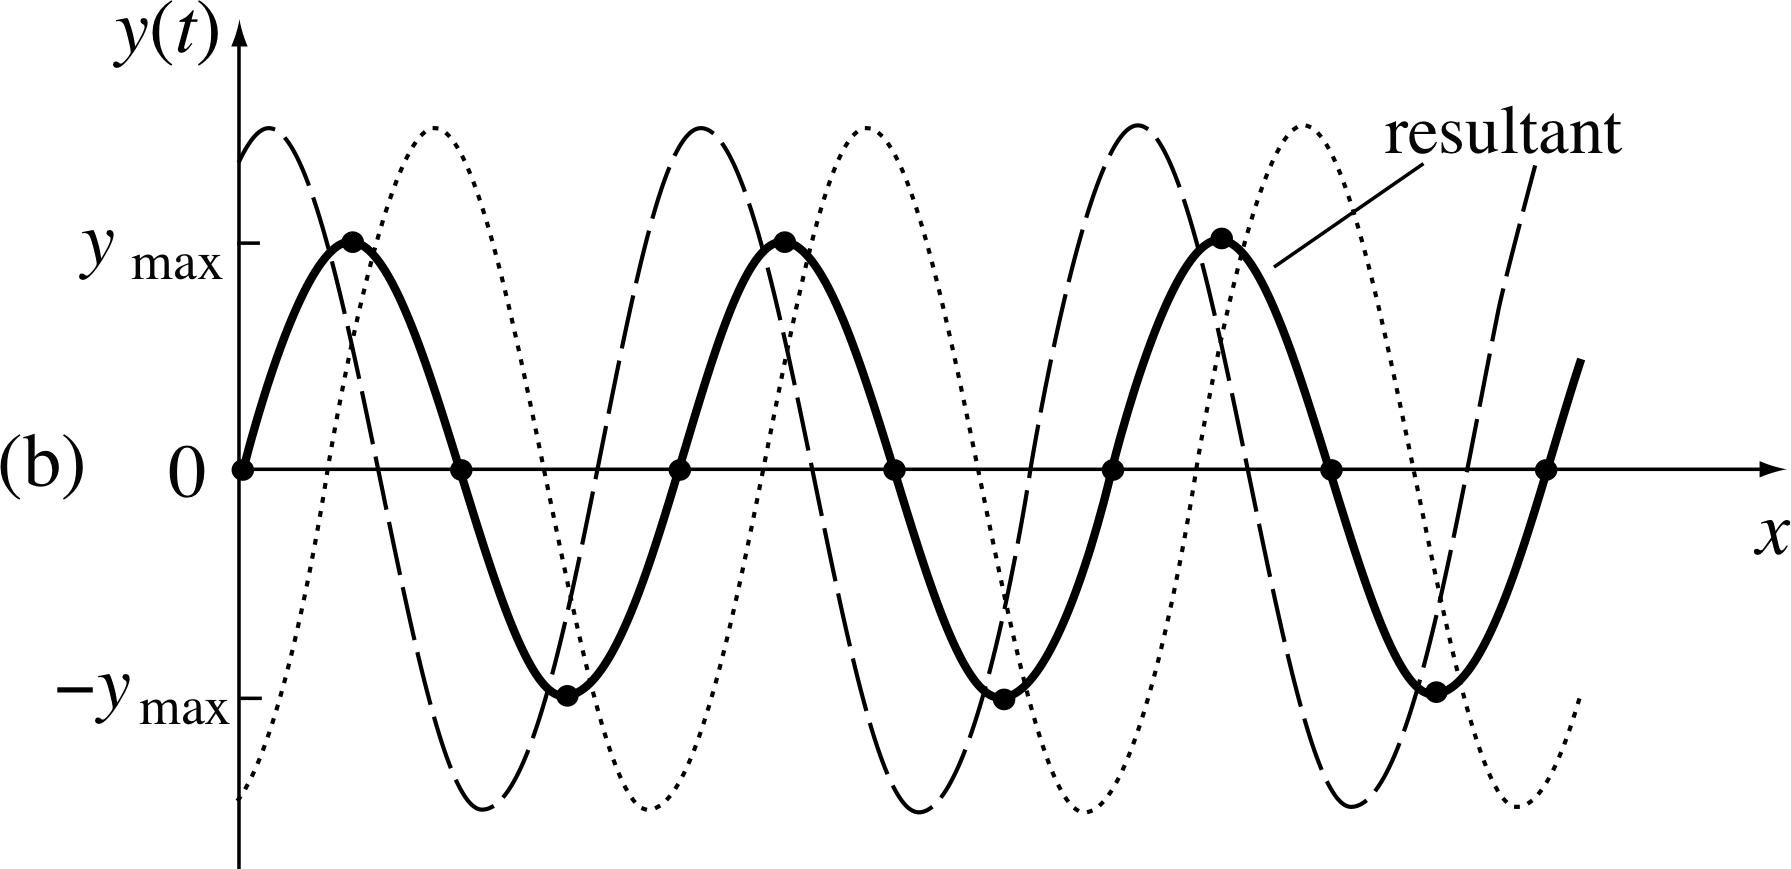
Figure 9b Superposition of two waves with the waves somewhat out of step (an intermediate phase difference).
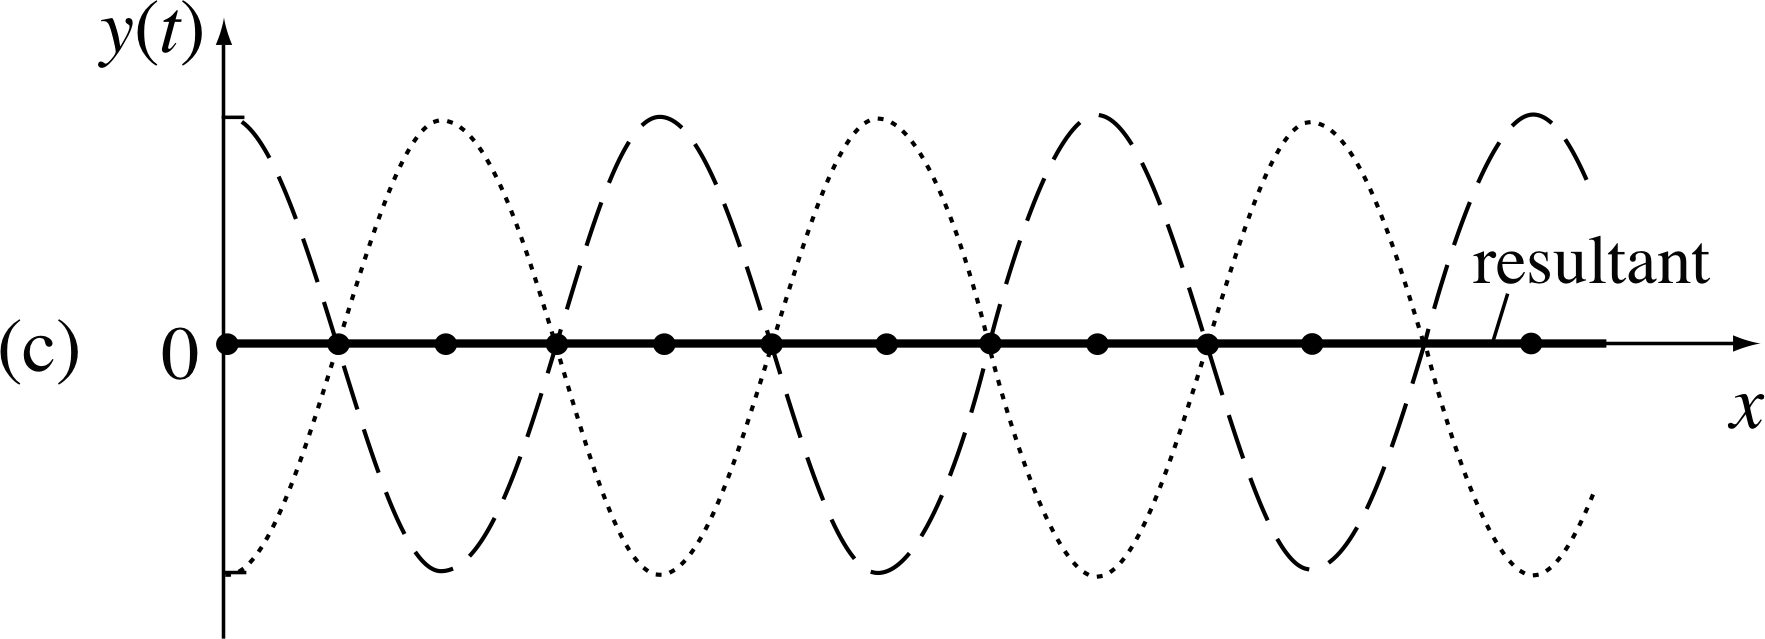
Figure 9c Superposition of two waves with the waves totally out of step (a phase difference of π radians or 180° or in anti-phase).
In general, if at time t two waves individually create disturbances y (t) and y (t) i at a particular point then their superposition will create a disturbance y (t) = y1(t) + y2(t) at that point. This is illustrated in Figure 9a where two waves of equal amplitude and wavelength (shown by differently dashed curves), both propagating in the x–direction, are combined to form a resultant (shown by a solid line). In Figure 9a the waves being combined are exactly in step (or in phase) and, in accordance with the superposition principle, their resultant causes twice the disturbance of the individual waves. Note in particular that the amplitude ymax of the resultant is twice the amplitude of each of the original waves.
Figure 9b shows what happens when the waves are somewhat out of step, the superposition principle still applies but the resulting wave has an amplitude that is less than twice the original amplitude.
Figure 9c shows the extreme case in which the two superposed waves are causing exactly opposite disturbances at each point; their effects now cancel one another completely so the resultant has zero amplitude.
The key point to note in this case is that the resultant in each part of Figure 9 has an amplitude that depends on the extent to which the waves being combined are out of step. This latter concept can be expressed quantitatively in terms of the phase difference ϕ between the waves. Phase difference is usually quoted as an angle, either in degrees (0 to 360) or radians (0 to 2π), and indicates the fraction of a wavelength (or period) by which the waves are out of step. For example, if at some particular instant two waves of identical wavelength that occupy the same region of space both cause their maximum disturbance at the same place (as in Figure 9a) then the phase difference between them is zero and we say they are in phase.
If on the other hand the peaks of one wave are separated from those of the other wave by half a wavelength (as in Figure 9c) the phase difference is π radians or 180° and the waves are said to be totally out of phase or in anti–phase. Any other fraction of a wavelength separating the peaks would be described by the corresponding fraction of 2π radians or 360°.
✦ Estimate the phase difference ϕ between the two waves being combined in Figure 9b.
✧ The peaks of the curve that has a maximum near x = 0 are about one–third of a wavelength behind those of the other dashed curve. Thus a possible answer is ϕ = 2π/3 or 120°. i However, you would be equally justified in claiming that the latter curve was two–thirds of a wavelength behind the former and answering ϕ = 4π/3 or 240°. When necessary, this sort of ambiguity is easily avoided by asking the extent to which one particular wave leads or lags the other.
When dealing with waves it is important to remember that the disturbances they cause vary from place to place and from one moment to the next. Thus, although we have just been discussing the phase difference between two waves at some particular instant, we might equally well have chosen to discuss the difference in phase between the oscillations that the waves caused at some particular point (or even at a pair of different points). If so, the phase difference between the waves would correspond to a fraction of a period rather than a fraction of a wavelength, but the essential idea would remain the same. It is hard to overemphasize the importance of realizing that waves involve changes in time and space and that along the path of a wave there is an oscillation taking place at every point.
Mathematically, if at some particular point i the oscillations caused by two different waves with the same wavelength can be described by expressions of the form y1(t) = A sin(ωt) and y2(t) = B sin(ωt + ϕ) where A, B, ω, and ϕ are constants and t represents time, then the phase difference between those waves is ϕ.
The term constructive interference is used to describe the condition in which two waves combine to produce a resultant with an amplitude which exceeds that of either of the original waves; fully constructive interference is when the waves are in phase and the amplitude of the resultant is the sum of the amplitudes of the combined waves. Destructive interference describes the condition in which two waves combine to produce a resultant with an amplitude which is less than that of either of the original waves; fully destructive interference is when the waves are totally out of phase and the amplitude of the resultant wave is the modulus of the difference in the amplitudes of the individual waves. i
In all cases of interference, the intensity of the resultant is given by the square of its amplitude (see Subsection 4.1). It follows that this intensity is not generally equal to the sum of the intensities of the two individual waves.
An example illustrates this important point. If two waves, each of amplitude A interfere fully constructively (Figure 9a) the combined wave will have amplitude 2A and intensity (2A)2 = 4A2. Separately the two waves each have intensity A2, and adding the intensities would give just 2A2; this is almost a case of ‘1 + 1 = 4’, or more informatively ‘(1 + 1)2 = 22 = 4’.
More striking still is the case of two waves, each of amplitude A, interfering fully destructively (Figure 9c). Here the superposition has both amplitude and intensity equal to zero. Thus, when dealing with energy transported by waves we have the possibility of two energy flows combining to give zero energy flow at one place and maximum energy flow at another!
Question T9
For the more general case, where the two waves of equal amplitude and wavelength interfere with a phase difference ϕ, the amplitude of the resultant is 2Acos(ϕ/2).
Prove this result by taking y1(t) = A sin(ωt) and y2(t) = A sin(ωt + ϕ) and then showing that y1(t) + y2(t) = 2A cos(ϕ/2) sin(ωt + ϕ/2). i
Answer T9
The expressions for y2(t) and y2(t) represent the disturbances due to two waves at a point in space, the second with a constant phase difference ϕ relative to the first. By the principle of superposition the net result is the sum of the displacements:
y (t) = y2(t) + y2(t) = A [sin(ωt) + sin(ωt + ϕ )]
Using a trigonometric identity for the sum of two sines we find:
$y(t) = 2A\left[\sin\left(\dfrac{\omega t + \omega t + \phi}{2}\right)\cos\left(\dfrac{\omega t-\omega t - \phi}{2}\right)\right]$
so$y(t) = 2A\cos\dfrac{\phi}{2}\sin(\omega t + \phi/2)$
where we have used cos(−ϕ/2) = cos(ϕ/2).
This represents an oscillation at frequency f = ω/2π with amplitude 2A cos(ϕ/2). If ϕ = 0 the sum amplitude is 2A, with intensity 4A2. This is fully constructive interference. If ϕ/2 = 90° (i.e. ϕ = 180°) then the net amplitude is zero and the intensity is zero. This is fully destructive interference. Any intermediate case can be found by choosing other values of ϕ.
5.2 Young’s two–slit experiment
We are now in a position to consider Young’s experiment, performed first in 1801 by Thomas Young; it remains an excellent demonstration of interference as it highlights all the conditions necessary for interference effects to be observed. i
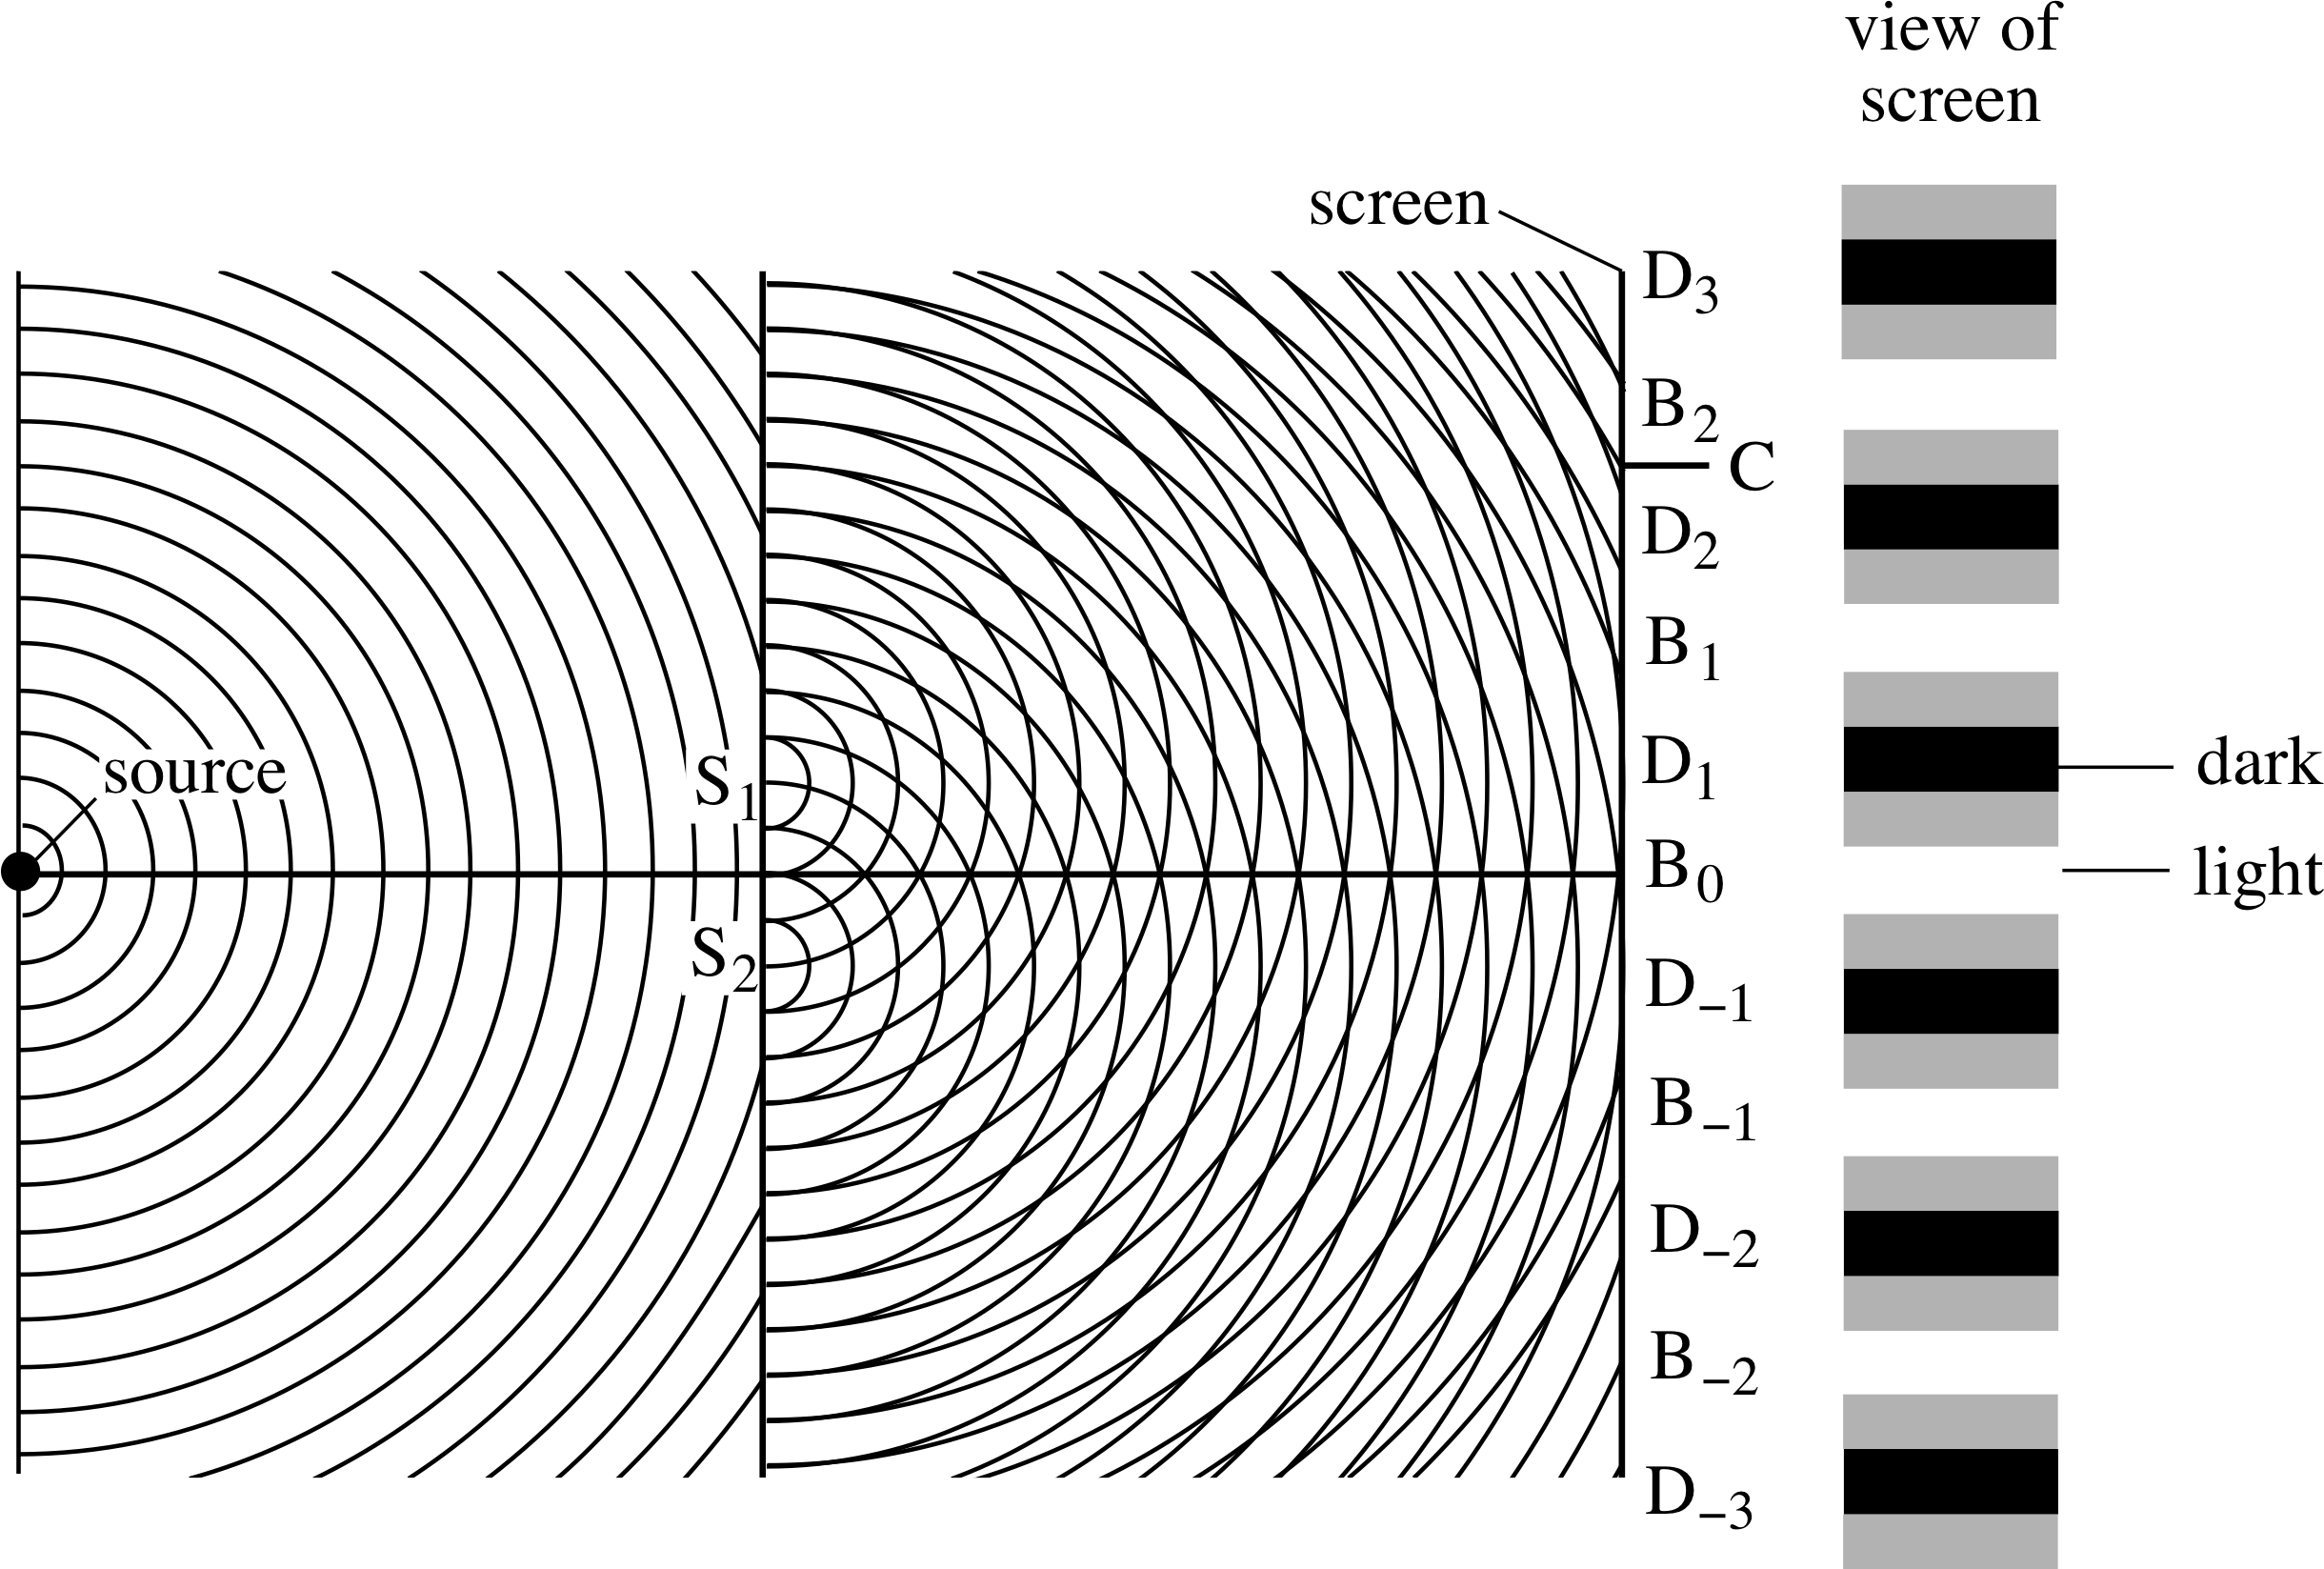
Figure 10 Young’s two–slit experiment. Wavefronts from a narrow source and S2 secondary wavelets from the double slits S1 and S2 are shown, along with a schematic representation of the interference fringes produced on the screen. (Not to scale.)
The schematic layout is shown in Figure 10. A narrow slit is placed in front of a source of light such as a sodium lamp (you will have seen such lamps as the yellow monochromatic street lamps) or an ordinary (white) incandescent lamp with a filter to select a single colour (i.e. wavelength) of light. Light from this slit illuminates a double slit which is placed a centimetre or so from the single slit. Each of the three slits is sufficiently narrow to act as a line of point sources or as a line source, with diffraction producing expanding cylindrical wavefronts (shown as circular in the two–dimensional plot) beyond the slits. The two expanding sets of wavefronts from the double slit overlap on a screen, placed about a metre away, where they interfere. i
The next subsection discusses why this particular arrangement is adopted, but first let us consider the observations.
The interference pattern seen on the screen includes regions where the light intensity is high, signifying constructive interference, separated by regions where the intensity is low, where destructive interference i occurs. These light and dark regions take the form of linear bands, called interference fringes (see Figure 10).
We can use Huygens’ construction and the principle of superposition to follow the light through the apparatus and to explain these observations. Each wavefront from the source slit arrives at S1 and S2 simultaneously so that these act as independent line sources emitting secondary wavelets that are in phase. The secondary wavelets expand as semicircles and the net wave disturbance at any point on the screen is calculated by adding the contributions from S1 and S2. The intensity at that point is then calculated from the square of the amplitude of the resultant disturbance. Consider Figure 10 and look first at what happens at position B0 on the screen. Wavefronts leaving S1 and S2 simultaneously always arrive at B0 at the same time so they are still in phase and there is fully constructive interference with an amplitude which is double that from a single slit; this produces a bright fringe with an intensity four times that from either slit alone. Similar situations exist at points B1, B−1, B2 and B−2 where the two wavelets still arrive in phase despite the fact that the wave from one slit has travelled an additional distance of one or two complete wavelengths relative to that from the other slit.
The difference in the distances from each slit to any point on the screen is called the path difference. An additional path difference of one or more complete wavelengths between the two wavelets arriving at B1, B−1, B2 and B−2 corresponds to an extra phase difference equal to some multiple of 2π, and this will not harm the fully constructive interference that occurs at each of those points. (This can also be seen in Figure 9a where it is impossible to tell whether one wave leads the other by zero, one, two or several whole wavelengths.) If we ignore the tiny difference in amplitude arising from the slightly different distances from the slits, the intensity of the light at B1, B−1, B2 and B−2 will also be four times the intensity due to each slit acting alone.
Now consider what happens at positions D1, D−1, D2 and D−2 on the screen. D1 and D−1 correspond to points on the screen for which there is a path difference from the slits of one–half wavelength and so the wavelets from each slit arrive totally out of phase at the screen, interfering destructively to give zero intensity and a dark fringe. Dark fringes are also produced at D2 and D−2, where the path difference is one and a half wavelengths. At position C the situation is intermediate, where there is a partially constructive interference of the two waves.
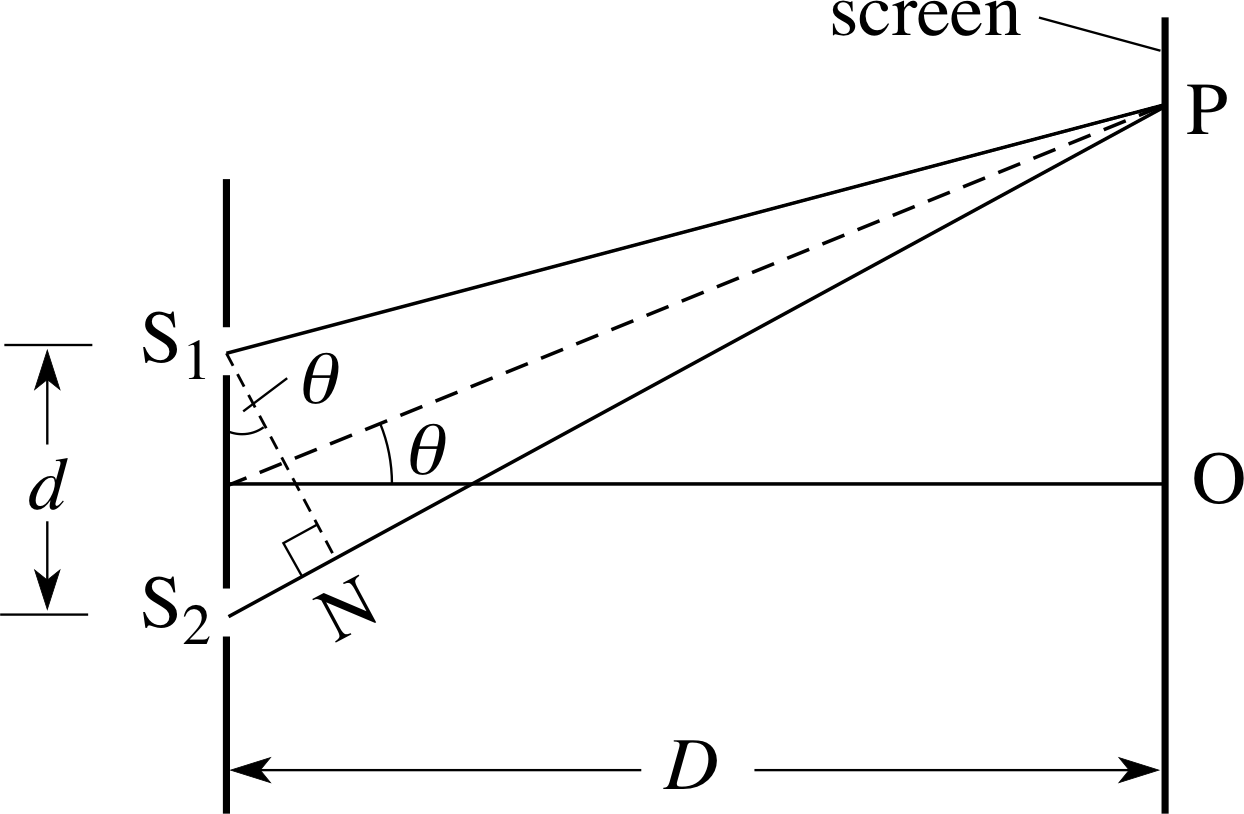
Figure 11 The path lengths from the slits to a distant screen.
It is straightforward to calculate the positions on the screen where fully constructive and fully destructive interference take place. In Figure 11 the path lengths from the two slits to a point P on the screen are shown. i The distance D is much greater than the slit separation d so that the angle θ from the ‘straight-through’ direction to point P is very small. Under these conditions the two paths S1P and S2P are essentially parallel and are at the same small angle, θ, to the straight–through direction.
For fully constructive interference the path difference must be an integral number of wavelengths, nλ, where n is an integer, so:
S2P − S1P = NS2 = nλ with n = 0, ±1, ±2, ±3, ...
For fully destructive interference the path difference is:
S2P − S1P = NS2 = (n + 1/2)λ with n = 0, ±1, ±2, ±3, ...
Look at the right–angled triangle S1NS2: the angle S2S^1N also equals θ, so that NS2 = d sin θ.
The condition for fully constructive interference then becomes:
d sin θ = nλ with n = 0, ±1, ±2, ±3, ...(7)
and the condition for fully destructive interference becomes:
d sin θ = (n + 1/2)λ with n = 0, ±1, ±2, ±3, ...(8)
From Figure 11 the distance OP is given by OP = D tan θ.
Since θ is small, sin θ ≈ tan θ ≈ θ = OP/D and the condition for bright fringes is therefore:
OP = Dθ = nDλ/d with n = 0, ±1, ±2, ±3, ...
The condition for dark fringes is:
OP = (n + 1/2)Dλ/d with n = 0, ±1, ±, ±3, ...
The whole number n determines the order of interference for the bright fringes.
Equation 7 has n = 0 for θ = 0, the zero order or ‘straight-through’ intensity maximum. Similarly, n = ±1 defines the first order maxima, n = ±2 the second order maxima, and so on. i
In some situations it is necessary to take into account the refractive index, μ, of the material through which light passes. The conditions for constructive/destructive interference arises from the path difference, expressed in terms of the wavelength in the material and this will generally differ from the wavelength in a vacuum by a factor of the refractive index, as we saw in Subsection 2.3:
λmaterial = λvacuum/μ(Eqn 2)
Interference conditions in a material can be expressed in terms of the optical path length in the material, and the wavelength in a vacuum. The optical path length is defined as:
optical path length = μ × geometrical path length(9)
The next question should help to make clear the value of this concept.
Question T10
The space between the slits and the screen in a Young’s two–slit experiment is filled with glass of refractive index μ. Show that the angles of the interference maxima are given by sin θ = nλ/μd.
Figure 11 The path lengths from the slits to a distant screen.
Answer T10
Refer to Figure 11.
The wavelength of the light between the slits and the screen is now λmedium = λ/μ. The condition for constructive interference becomes:
NS2 = nλmedium = nλ/μ
But NS2 = d sin θ so that d sin θ = nλ/μ
If this is rearranged we have the result: sin θ = nλ/μd.
5.3 Coherence – a condition necessary to observe interference
Our discussion of interference so far has ignored an important condition which is necessary to observe interference. This condition is known as coherence and it determines how predictable the phase difference is between two waves. The production of an observable interference fringe requires that the conditions for constructive or destructive interference (set by the phase relationships) should persist long enough in time to permit an observation, and extend far enough in space for the fringe to have some observable width. If the two interfering waves were both ideal plane waves with exactly the same wavelength or frequency then perfect coherence would be possible and knowledge of their phase difference at one point and time would ensure that the phase difference at any other point and time could be predicted – the waves would have perfect temporal coherence and spatial coherence. Unfortunately the reality for actual light sources are quite different.
- No source really produces light of a single frequency (i.e. monochromaticmonochromatic light) but rather a range of different frequencies – so when we superimpose these the phase differences of the waves are no longer perfectly defined. The frequency of light is so high (about 5 × 10¹⁴ Hz) that even a tiny spread of frequencies produces a range of phase differences. In practical terms each frequency in the source produces its own independent set of fringes and when these are superimposed the visibility of all the fringes will be impaired since each set of intensity maxima will be at a different position. (There is an exception to this when all wavelengths give a minimum at the point of observation – then a ‘black fringe’ will be produced.)
- No source is a true point source – so when we collect light from different points to make a beam there will inevitably be different path lengths involved and consequently a range of phase differences. In practical terms each point on the source produces its own independent set of fringes and when these are superimposed the visibility of the fringes will again be impaired. Even for a monochromatic source the visibility of the fringes will be compromised by the size of the source.
Both of these problems contribute to the phase uncertainties in any interference experiment and the coherence is limited by the source available. A source with high coherence is said to be coherent and one with very low coherence is said to be incoherent. When two coherent waves add together they do so by the superposition principle, their displacements are added and the resultant amplitude must be squared to give the intensity. If the waves are incoherent then the two waves act independently and the resultant intensity is just the sum of the two separate intensities. The reason for this is that any interference condition holds only instantaneously and the average over time at any point becomes the sum of the separate intensities.
A point monochromatic source would give perfect coherence but such a situation is unattainable. i Despite this, we can obtain reasonable fringes, as in Young’s experiment, by using a coloured filter to isolate a narrow frequency range (providing adequate temporal coherence) and narrow slits to restrict the source size (providing adequate spatial coherence). In this process we gain coherence at the expense of light intensity and we must seek a compromise between these two to produce the most visible fringes.
5.4 Interference of light reflected from thin films
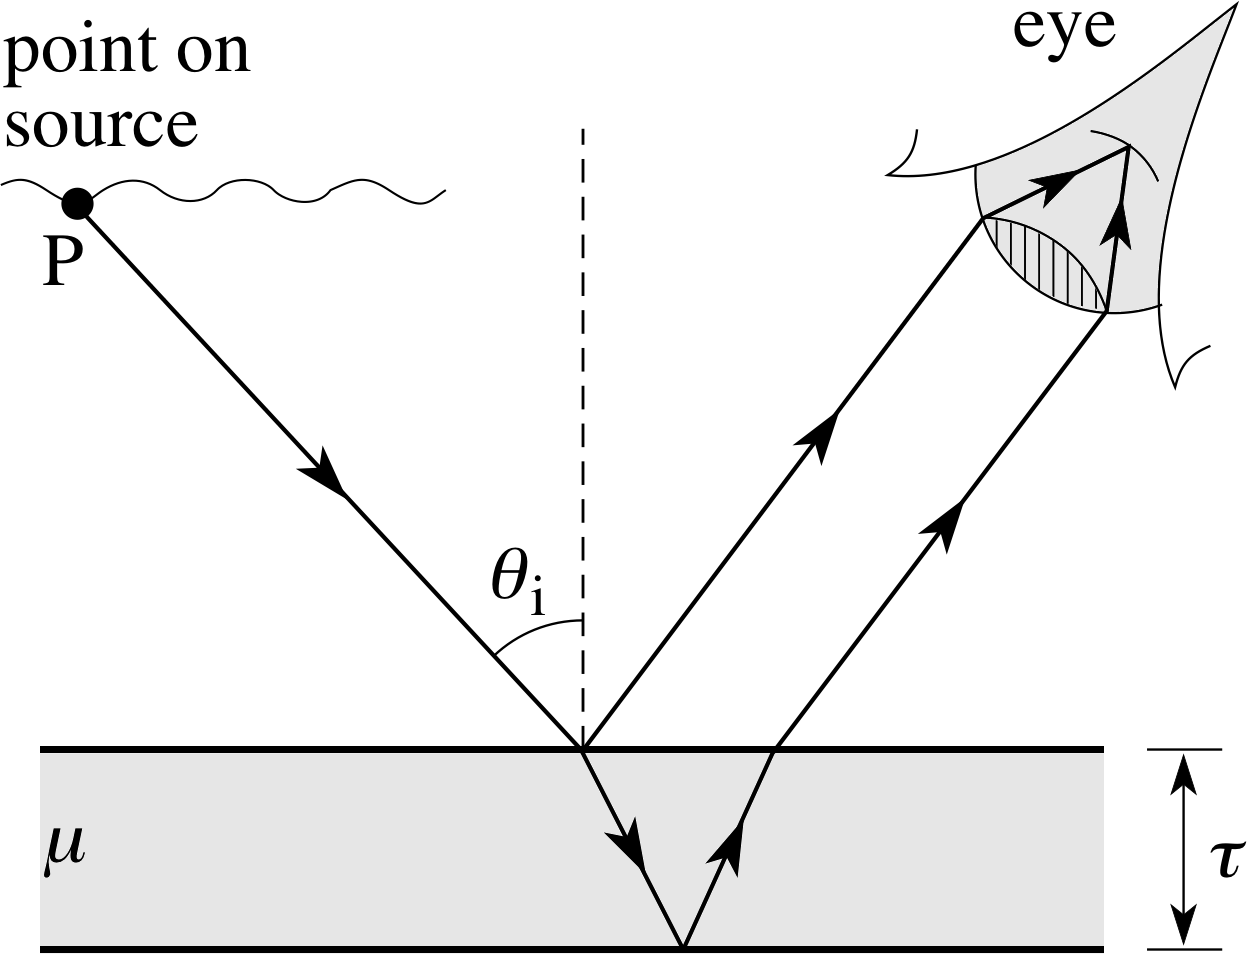
Figure 12 Rays reflected from a thin film.
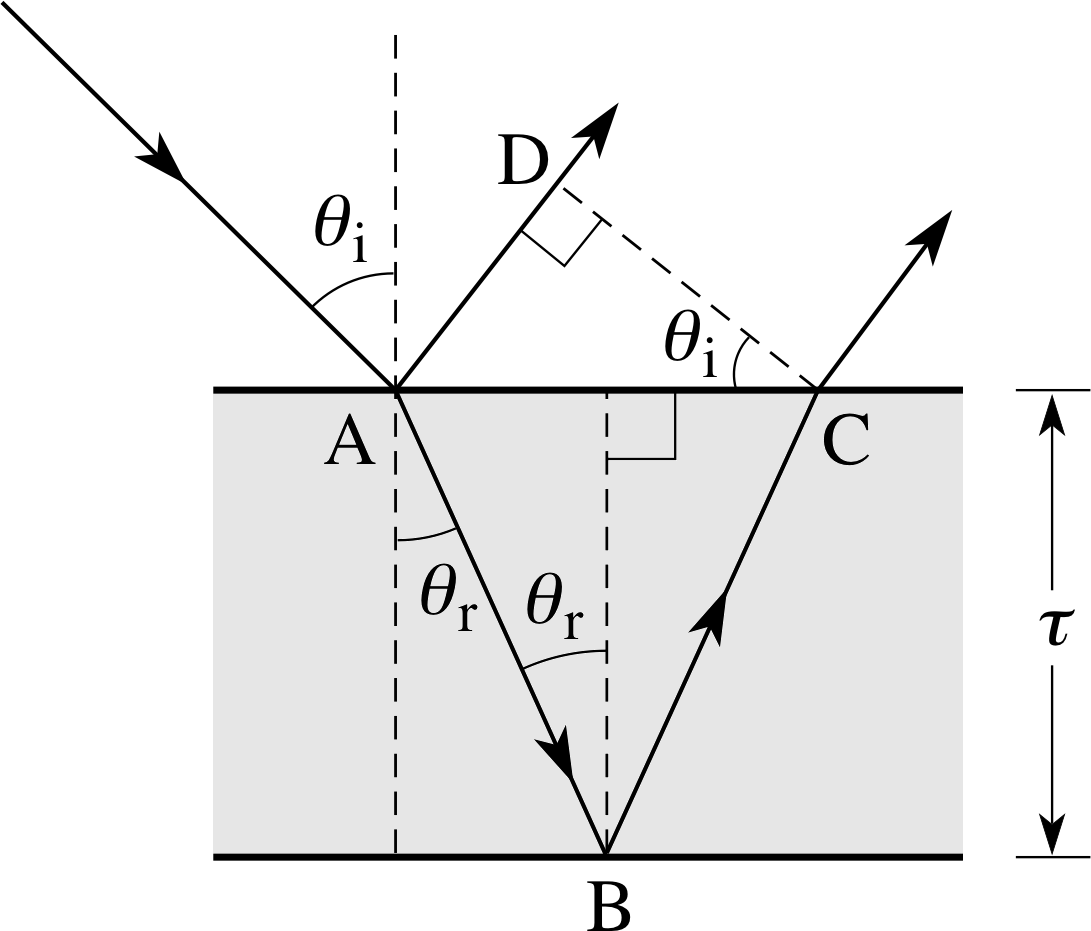
Figure 13 The details of the reflection and refraction at the thin film.
When light of a given wavelength from a point on a source falls on to a thin film the wavefronts reflected from the top and bottom surfaces of the film are coherent, so if these two sets of wavefronts are then brought together there will be interference. It is convenient to discuss this problem in terms of the ray representation, since we are not intending to restrict the wavefronts significantly and the ray paths give the optical path lengths, path differences and hence the phase differences. Figure 12 shows a ray of light of a given wavelength leaving a point P on a source and having an angle of incidence θi to a thin film of transparent material of thickness τ and refractive index μ. (If a white light source is used the discussion that follows can be applied to each separate wavelength in the light from P.)
The ray arriving at the film is partially reflected at the top and bottom surfaces of the film to produce two parallel rays which can be made to converge on a screen by means of a lens. The lens of a human eye is shown to emphasize that the effects can be viewed directly. We will assume that the film has refractive index μ > 1.0 and that elsewhere μ = 1.0. A soap film in air would be an example.
The details of the reflection and refraction are shown in Figure 13.
From Equation 9,
optical path length = μ × geometrical path length(Eqn 9)
the optical path difference x between the two rays reflected from the top and bottom of the film is
x = μ (AB + BC) − AD
If θr is the angle of refraction and τ is the film thickness, trigonometry gives i
x = 2μτ cos θr(10)
You might expect that the condition for constructive interference, when the two waves are recombined by the lens, is x = nλ; but this is wrong! It turns out that the reflection of one of the rays from the upper surface (such as at A in Figure 13) where the refractive index increases along the direction of propagation introduces an additional phase difference of π. (The reflection from the lower surface, such as at B, where the refractive index is decreasing, doesn’t produce any compensating phase difference.) i
The condition for fully constructive interference when one reflection introduces the π phase difference is then:
x = (n + 1/2)λ with n = 1, 2, 3, ...
and for fully destructive interference:
x = nλ with n = 1, 2, 3, ...
Substitution in Equation 10 then gives:
The interference conditions when one reflection introduces the π phase difference:
2μτ cos θr = (n + 1/2)λ for constructive interference(11)
and2μτ cos θr = nλ for destructive interference(12)
If the film is illuminated by an extended source of monochromatic light then an interference pattern will be seen in the film with bright fringes wherever Equation 11 is satisfied.
In practice changes in film thickness τ are usually more significant than changes in the refraction angle θr, so the fringes follow contours of equal film thickness. If the monochromatic light source is replaced by an extended source of white light that contains many different wavelengths then what is seen will be the result of adding together many interference patterns and will consist of a pattern of coloured bands. This is why a soap film or an oil film on water appears coloured when viewed in daylight. i
Alternatively, if a parallel beam of white light is incident then, at a fixed angle of view, the reflected light appears white to the eye but closer examination reveals that it is deficient in those particular wavelengths which have suffered destructive interference from the film.
Question T11
Green light is reflected at normal incidence (θi = θr = 90°) from a film of soap solution in air. Calculate the smallest thickness at which constructive interference takes place. (Assume λ = 550 nm and μ = 1.30)
Answer T11
The condition for constructive interference, when one reflection suffers a π phase change, is given by Equation 11,
2μτ cos θr = (n + 1/2)λ for constructive interference(Eqn 11)
For n = 0 and μ = 1.3 and at normal incidence
$\dfrac{\sin\theta_{\rm i}}{\sin\theta_{\rm r}} = \mu$ (Snell’s Law)
Therefore$\sin\theta_{\rm r}= \dfrac{0}{1.3}$
soθr = 0°
Now$\tau = \dfrac{(n + 1/2)\lambda}{2\mu\cos\theta_{\rm r}} = \dfrac{\lambda}{4\times1.3} = \rm \dfrac{550\,nm}{4\times1.3} = 106\,\mu m$
There are many important applications of these principles in optical technology. First, the process described above can be used to remove a particular wavelength by passing light through an interference filter, made by applying a thin transparent coating to a glass base. Second, anti–reflection coatings applied to the many air– glass surfaces in a multi–component camera lens can reduce the amount of light reflected at each of those surfaces to well below the usual 4% of the incident intensity. This coating material has a refractive index intermediate between glass and air; magnesium fluoride (μ = 1.38) is a common choice because of its durability. The film thickness is set to give destructive interference for light reflected from the front and back surfaces of the coating and there is then minimum reflected light and maximum transmitted light. In this case the reflections at the upper and lower surfaces of each coating occur where the refractive index is increasing and so each reflection involves the π phase difference. Thus the relevant conditions are:
The interference conditions when both reflections (or neither) introduce the π phase difference:
2μτ cos θr = nλ for constructive interference(13)
and2μτ cos θr = (n + 1/2)λ for destructive interference(14)
Destructive interference at normal incidence (cos θr = 1) then requires a minimum film thickness (n = 0) given by τ = λ/4μ. i
Question T12
Calculate the minimum thickness of a magnesium fluoride anti–reflection coating required for a camera lens. (Assume λ is about 550 nm.)
Answer T12
Here we have a phase change of π at both surfaces. Equation 14,
2μτ cos θr = (n + 1/2)λ for destructive interference(Eqn 14)
gives the condition for destructive interference for reflection at normal incidence as: 2μτ = (n + 1/2)λ.
For minimum thickness we put n = 0 for zero order, μ = 1.38 and λ = 550 nm to find:
$\tau = \left(n+\dfrac12\right)\dfrac{\lambda}{2\mu} = \dfrac{\lambda}{4\mu} = \rm \left(\dfrac{550\,nm}{4\times1.38}\right) = 99.6\,nm$
Another application of thin film technology is the production of a high reflectivity mirror for a particular wavelength. This is done by coating glass with several layers and adjusting the thickness of each layer to give reinforcement of the front and back reflections. Mirrors of this type may have very many transparent layers, with alternating high and low refractive index, and can reflect more than 99% of the incident intensity at the selected wavelength – far more than can be achieved by a single coating of silver on glass (which gives about 80%).
5.5 The diffraction grating
The diffraction grating is a very important device which is used in the analysis of the wavelength components of a beam of light. It is found in all student physics laboratories and research laboratories and its performance is superior to that of a glass prism. Rather than ‘diffraction grating’ a better name would be ‘interference grating’ since it functions like Young’s slits except that it is has thousands of slits rather than two. Instead of two interfering sources the diffraction grating is a multiple beam interference device, which produces much sharper interference maxima than the double slit. To understand the diffraction grating we will return to the two–slit experiment and ask what happens to the interference pattern as the number of slits is increased.
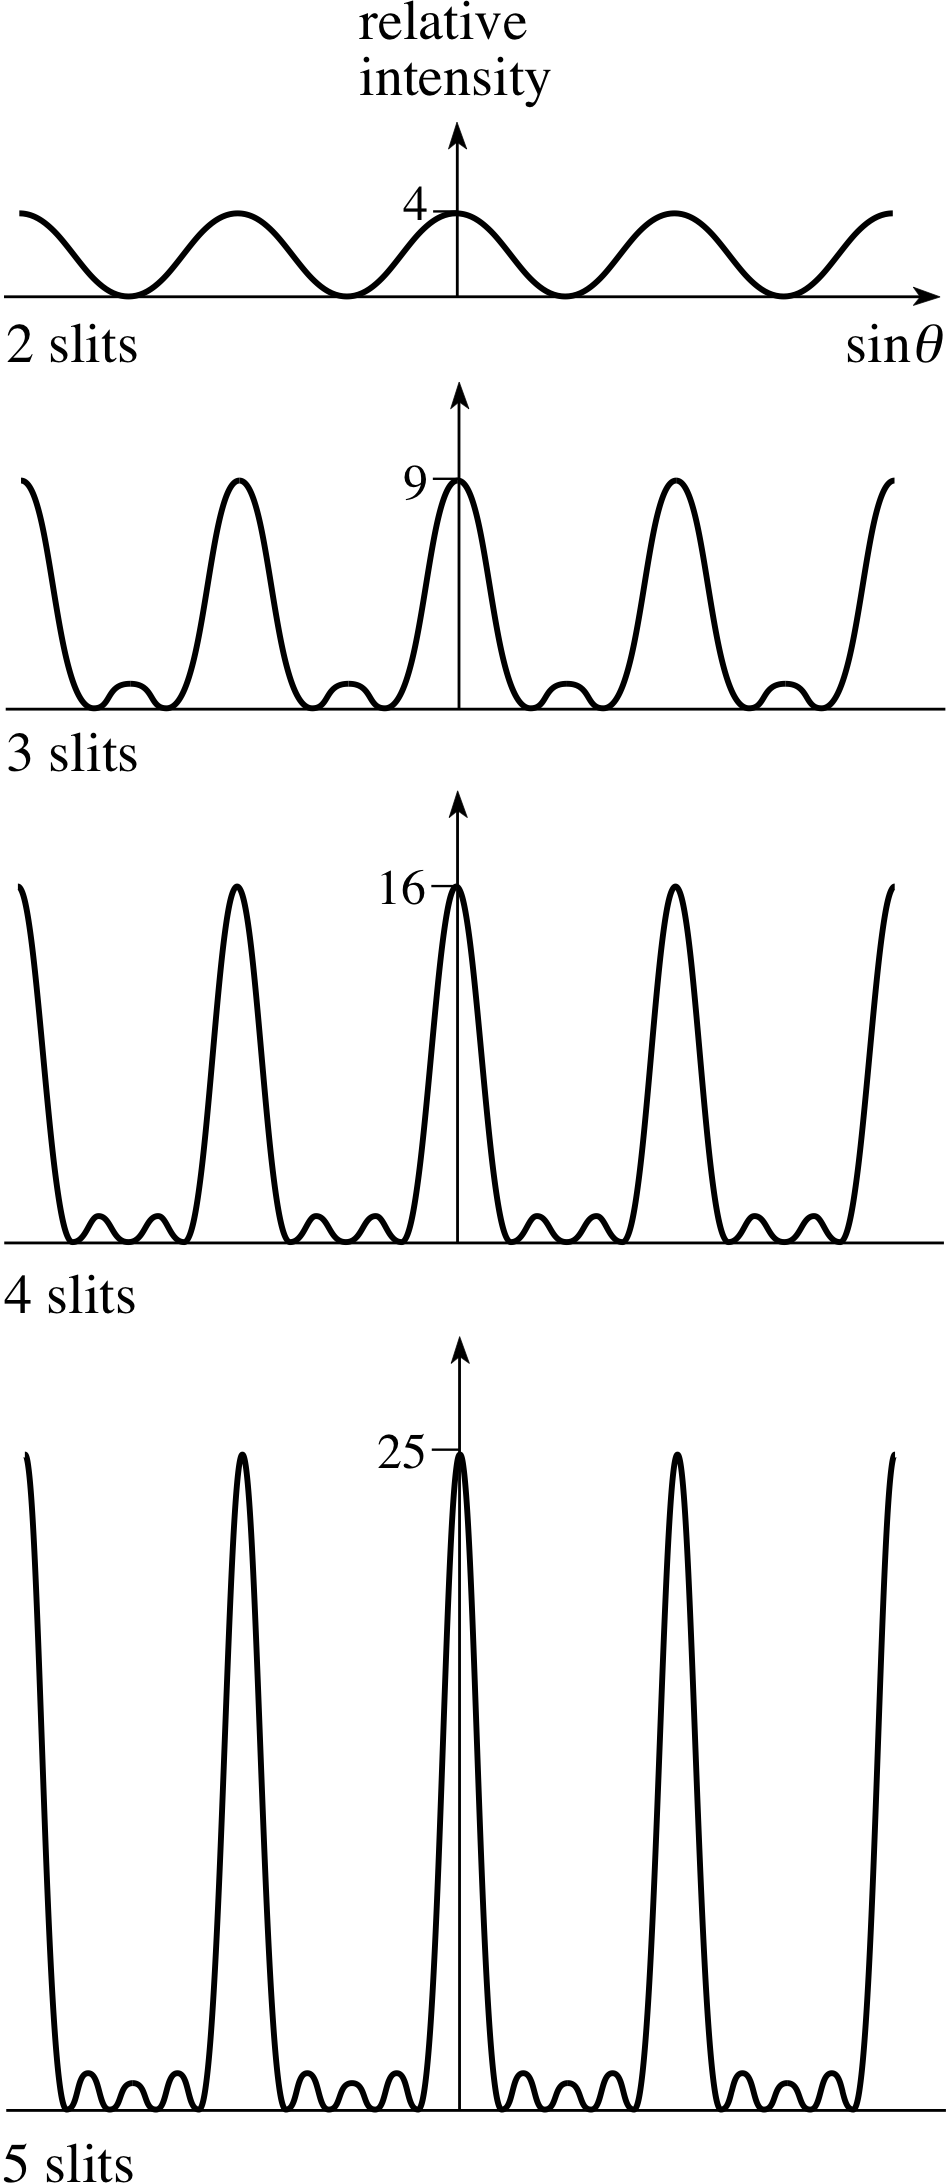
Figure 14 The interference patterns produced by sets of 2, 3, 4 and 5 equally spaced narrow slits.
Figure 14 shows the interference patterns produced by monochromatic (i.e. single wavelength) light passing through sets of 2, 3, 4 and 5 equally spaced narrow (line source) slits. You should note particularly that:
- The main maxima or principal maxima occur at the same positions for any number of slits.
- The principal maxima become more intense and sharper as the number of slits increases.
- Smaller maxima or subsidiary maxima appear between the principal maxima when there are more than two slits.
- The subsidiary maxima become more numerous but relatively smaller and less intense as the number of slits increases.
A more detailed examination of Figure 14 or a theoretical analysis of the pattern reveals two additional points, both of which play a vital part in making the diffraction grating so important:
- The peak intensity of the principal maxima rises with the square of the
- number of slits.
- The width of the principal maxima decreases linearly with the number of slits.
These two additional points can be justified, without too much mathematics, in the following way. From what was said in Subsections 5.2 and 5.4 you will know that at a point of fully constructive interference the intensity due to the coherent super–position of waves from two slits is four times that from a single slit. It is reasonable therefore that the coherent superposition of waves from N slits provides N 2 times the intensity from one slit. The width is a little more tricky but this too can be deduced from energy considerations. The total amount of energy reaching the screen from N identical slits must be N times that from one slit. If we neglect all light outside the principal maxima and remember that these have peak intensities rising as N 2 then they must narrow in proportion to N so that the product of their width and peak intensity (i.e. their area and the total energy they pass) can increase as N.
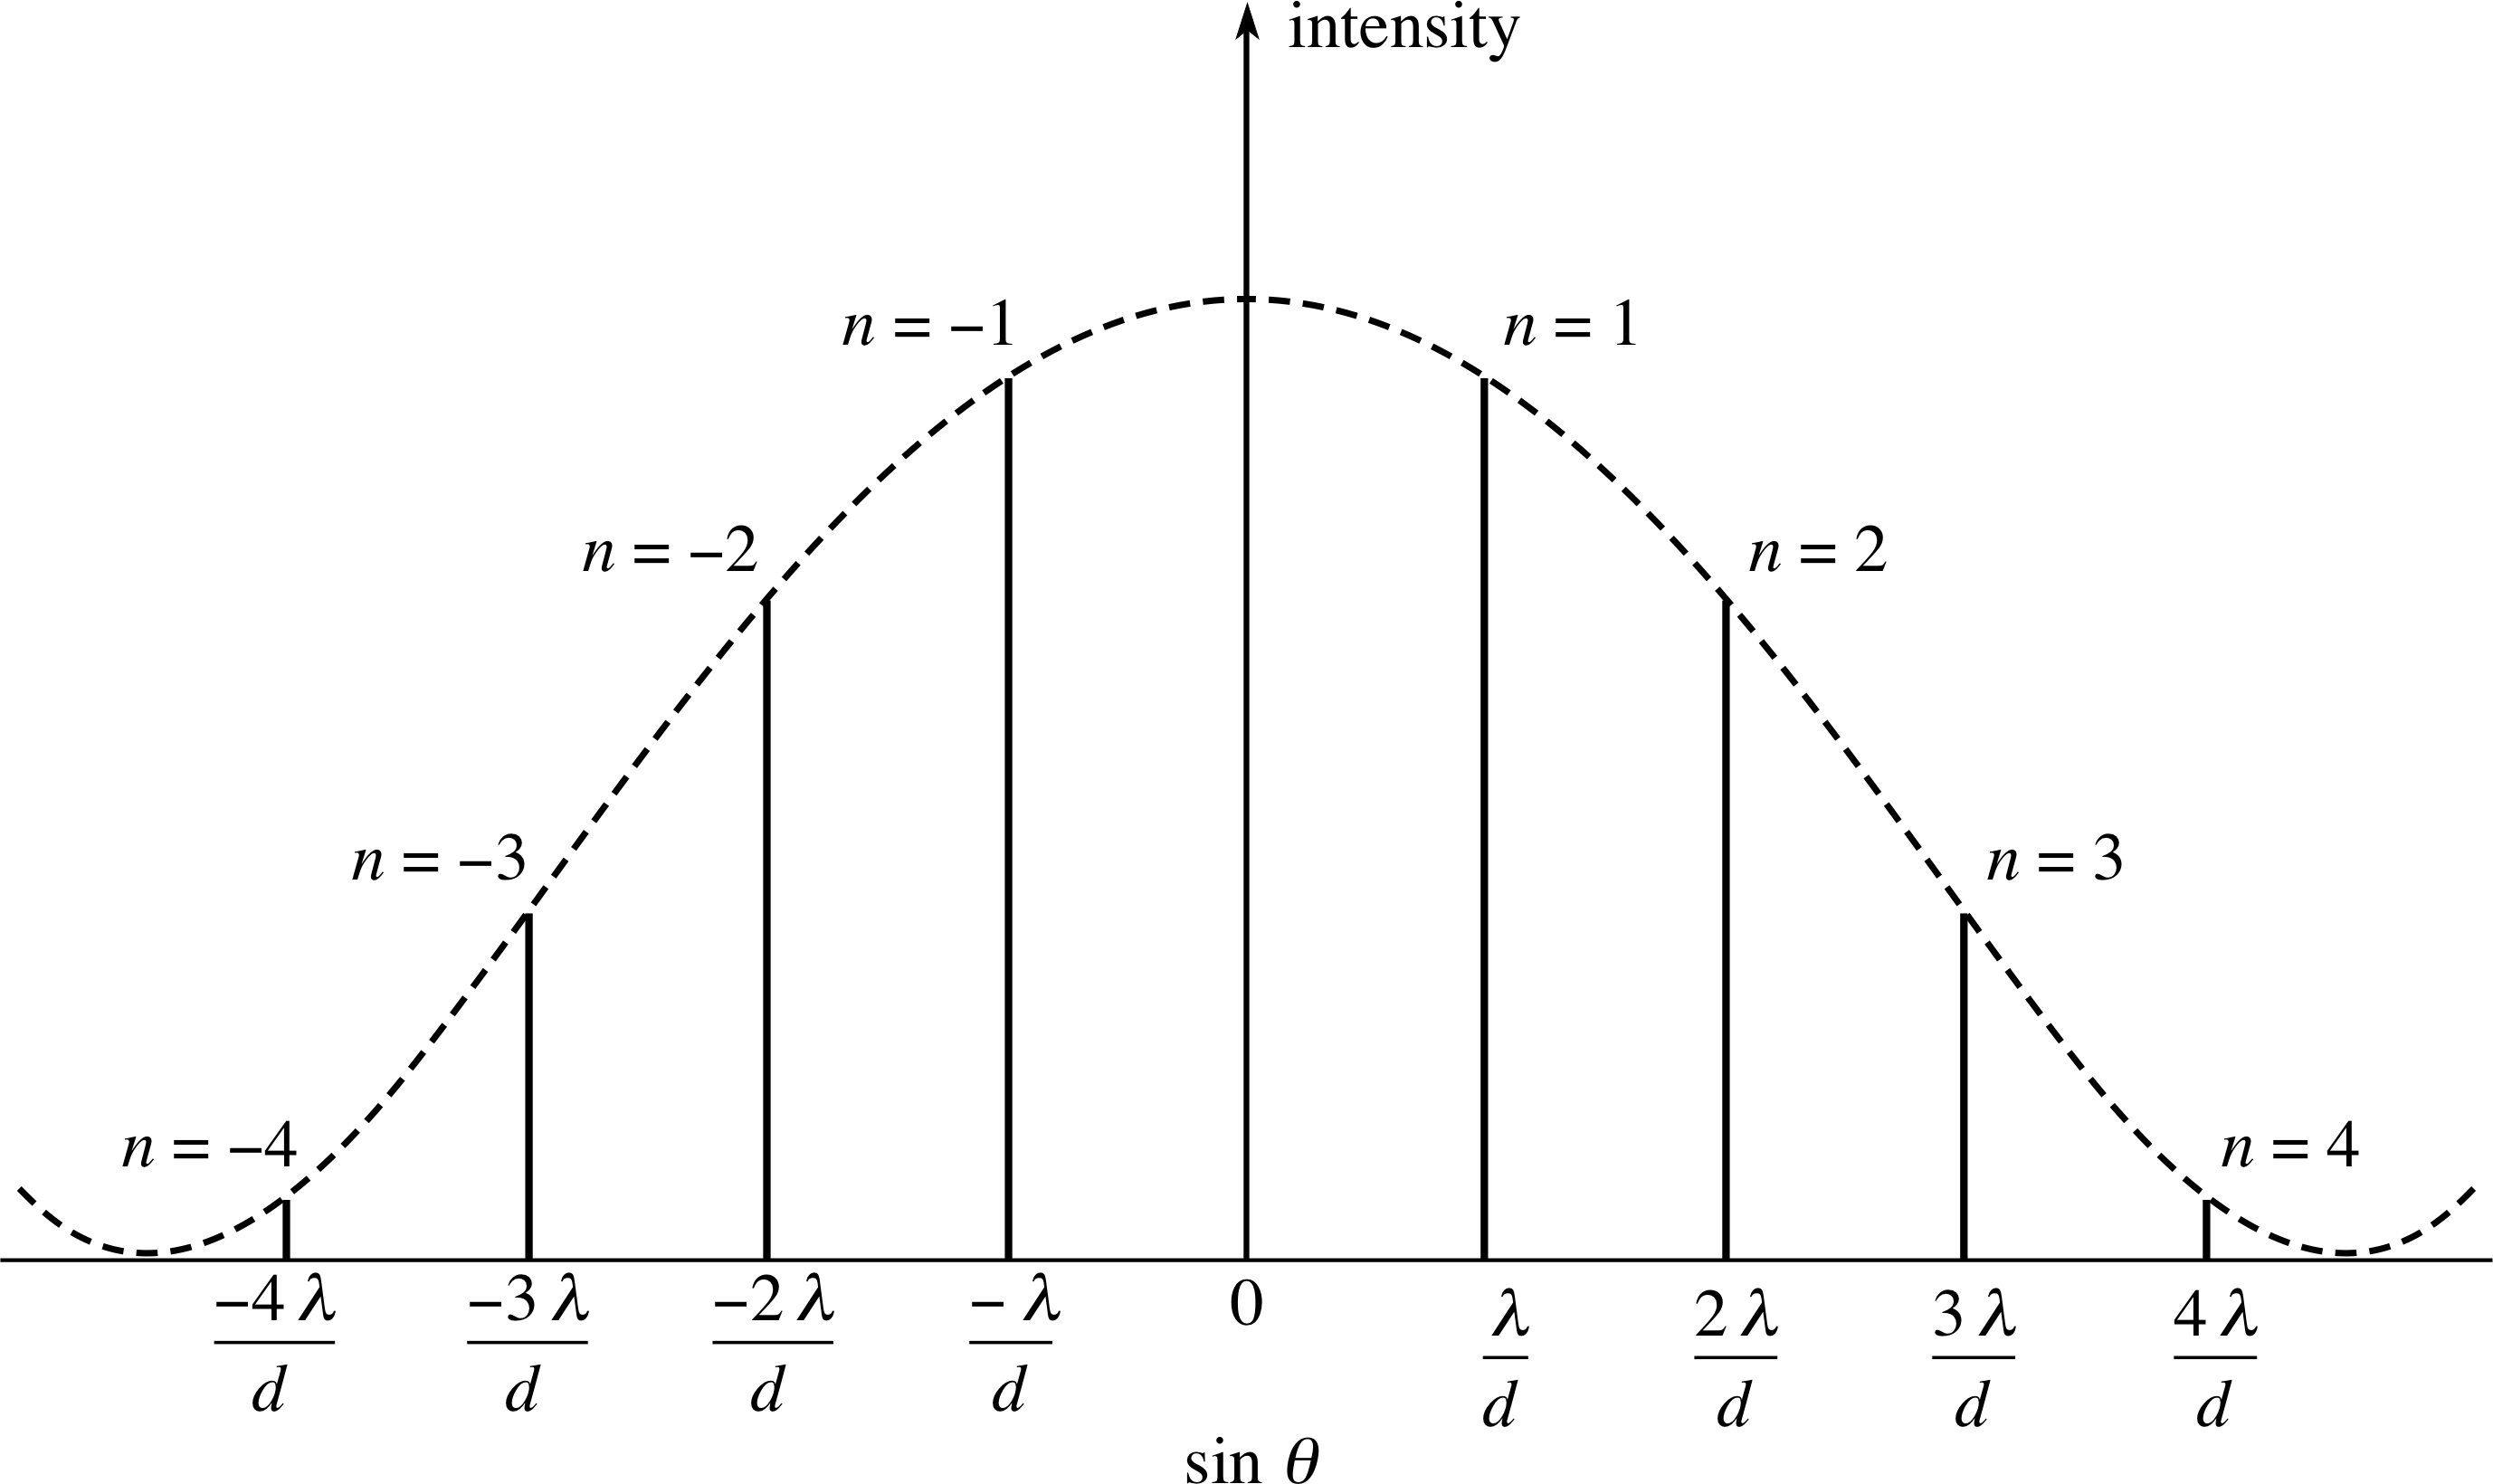
Figure 15 The intensity distribution from a diffraction grating with a slit separation of about four times the width of the slits. i
Figure 15 shows the situation for a real diffraction grating, with more than 1000 equispaced slits. In this figure the intensity is plotted on the vertical axis and sin θ along the horizontal axis, where d, the grating spacing, is the distance between the centres of adjacent slits. The angle θ is defined as in Figure 11 for Young’s slits. With so many slits, only the principal maxima are now significant and they are so sharp that they can be drawn as vertical lines.
The plot of Figure 15 emphasizes that Equation 7 is just as valid for locating the principal maxima of a diffraction grating as it was in the two–slit case. Regardless of the number of slits it is still true that at each principal maximum:
d sin θ = nλ with n = 0, ±1, ±2, ±3, ...(Eqn 7)
However, in the case of a diffraction grating the integer n is often referred to as the order of diffraction rather than the order of interference.
A new and perhaps surprising feature can be seen in Figure 15. The various principal maxima no longer have the same intensity, as they did in Figure 14. This is because these slits cannot be taken as line sources. Their width is about a quarter of their separation in this case. The diffraction from these slits is less than it would be from ideal line sources, so less light reaches large angles and the principal maxima at higher values of n, have a reduced intensity.
In practice, of course, the slits must not be too narrow if sufficient light is to be passed to see the orders! In the next subsection we will consider the diffraction pattern from a single slit when the slit is appreciably wider than a line source, and then we can return to this point. Meanwhile, it is important to remember that although the relative intensity of the principal maxima depends on details of the slit geometry they always appear at angles θn given by a rearrangement of Equation 7:
$\sin\theta_n = \dfrac{nλ}{d}$ with n = 0, ±1, ±2, ...(15) i
In practice, a typical grating has several thousand slits, each just a few micrometres from its nearest neighbours. Any particular principal maximum will be very narrow and will cover a very tiny range of angles around the value of θn given by Equation 15. Nonetheless, that range of angles is finite and given its value we could use Equation 15 to work out the various different wavelengths that might have principal maxima within that narrow angular range. This is an interesting quantity because it corresponds to the range of wavelengths that cannot be clearly distinguished from one another at that particular principal maximum. In practice this range of wavelengths is very small; it might well be less than 0.1 nm at the first order maximum for light of wavelength 550 nm. It is the narrowness of these maxima that gives the diffraction grating its great ability to separate light waves with only slightly different wavelengths.
So far we have described a diffraction grating as an array of slits which transmit light; this type is properly described as a transmission diffraction grating. The essential feature of a diffraction grating is that it is a device which imposes a periodic variation onto an incident wavefront. Producing a periodic spatial variation in transmitted intensity is just one way of achieving this. There are several other possibilities, including reflecting the wavefront from a surface of periodic reflectivity. For example, a regular array of narrow lines etched onto a mirror surface produces a reflection diffraction grating. This will produce several reflected orders of diffraction for any incident beam. The zero order maximum obeys the usual law of reflection, having an angle of reflection equal to the angle of incidence, but higher order maxima may be seen on either side of this zero order maximum. i
Some diffraction gratings occur naturally. For example, the regular spacing of the atoms in a crystal is about 0.1 nm and the separate atomic layers in a crystal act as a very good reflection diffraction grating for X–rays, which have wavelengths in this region. There are also naturally–occurring diffraction gratings for visible light, which brings us to the peacock’s tail!
Question T13
The feathers of a peacock’s tail contain layers of cells in a regular pattern, repeating at intervals of about 500 nm. This forms a natural reflection diffraction grating for light. If white light is shining at normal incidence on to the tail, show that only the green to violet part of the spectrum can appear with first order interference maxima. Explain briefly why the reflected colours change slightly as the viewing angle changes.
[Hint: Equation 15 is valid at normal incidence for a reflection grating.]
Answer T13
The cells behave as a reflection diffraction grating with grating spacing d = 500 nm. If Equation 15,
$\sin\theta_n = \dfrac{n\lambda}{d}$ with n = 0, ±1, ±2, ...(Eqn 15)
holds for light incident at an angle of incidence of 90° and the maximum value of sin θ = 1, the maximum wavelength which can be observed in first order is:
$\lambda_{\rm max} = \rm \dfrac{d(\sin\theta)_{max}}{n} = \dfrac{500\,nm}{1} = 500\,nm$
Only wavelengths below 500 nm can be seen in first order interference maxima from the grating when it is illuminated at 90° incidence. All such wavelengths are in the green to violet part of the spectrum. For example, first order blue light with λ = 450 nm appears at:
$\theta = \arcsin\left(\dfrac{450}{500}\right) = 64°$
The feathers appear to change colour as we view them at different angles but they are always within the range of green to violet.
5.6 Fraunhofer diffraction at a single slit
Finally in this module, we consider in more detail the diffraction pattern from a single slit when the slit is wide compared with a line source. In Subsection 3.2 we showed that when light is diffracted by a single slit the diffraction increases as the slit width is reduced.
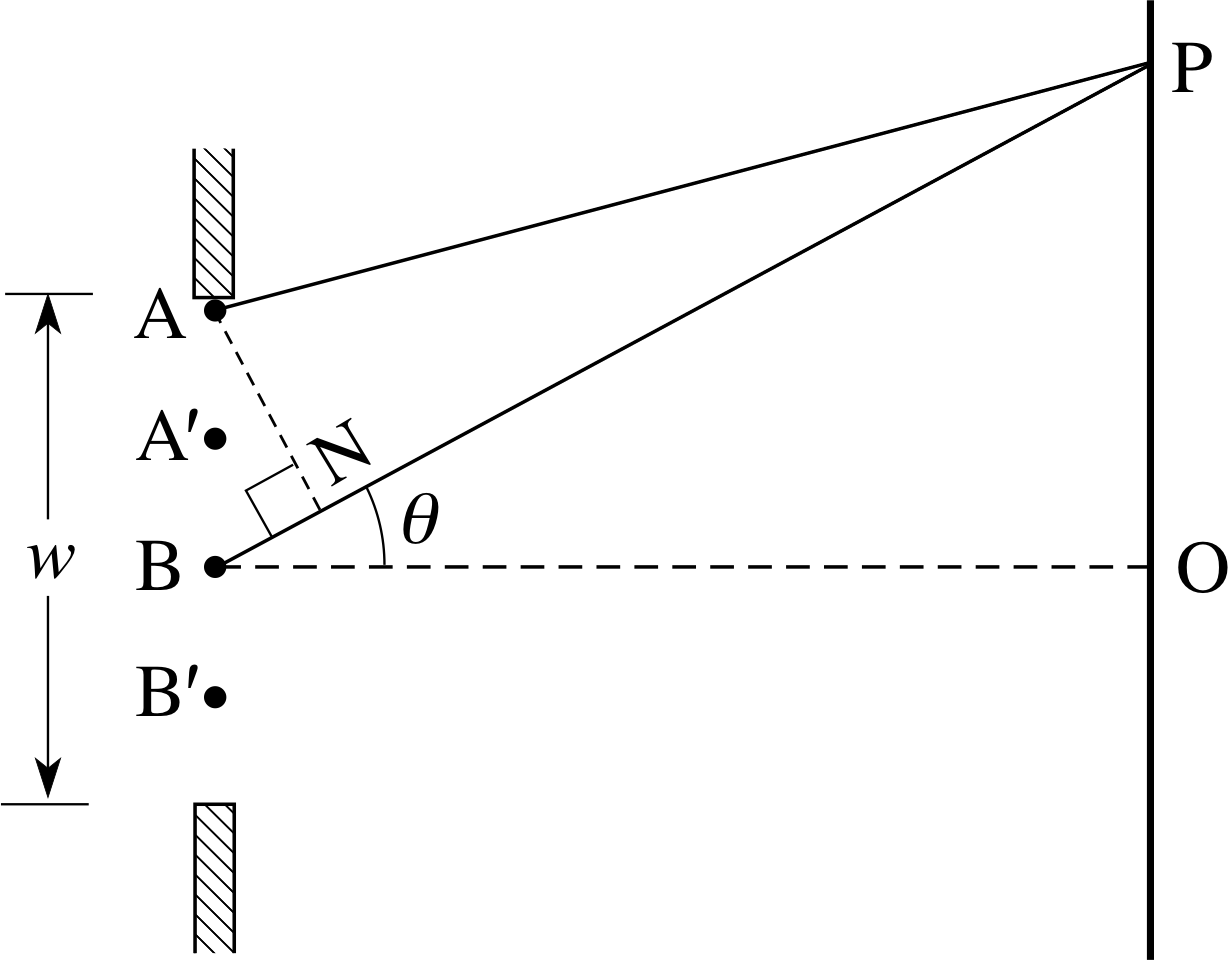
Figure 16 Fraunhofer diffraction at a single slit.
We can now investigate the intensity pattern on the screen as the slit width changes. If the slit were less than one wavelength wide then the light would be spread uniformly over the screen, but what is the diffraction pattern from a slit of width w when w is considerably greater than λ? The following discussion shows that this topic is correctly placed here, in the section on interference.
We can demonstrate what is called Fraunhofer diffraction at a wide single slit by using an arrangement similar to that for Young’s two–slit experiment (Figure 10), except that the slits S1 and S2 are replaced by the single slit. This wide slit must be sufficiently far from the source that it is illuminated by a plane wavefront and the screen needs to be about a metre from the wide slit. i Figure 16 shows the wide slit and the screen, although the distance to the screen has been reduced for ease of illustration; the angle θ is actually very small.
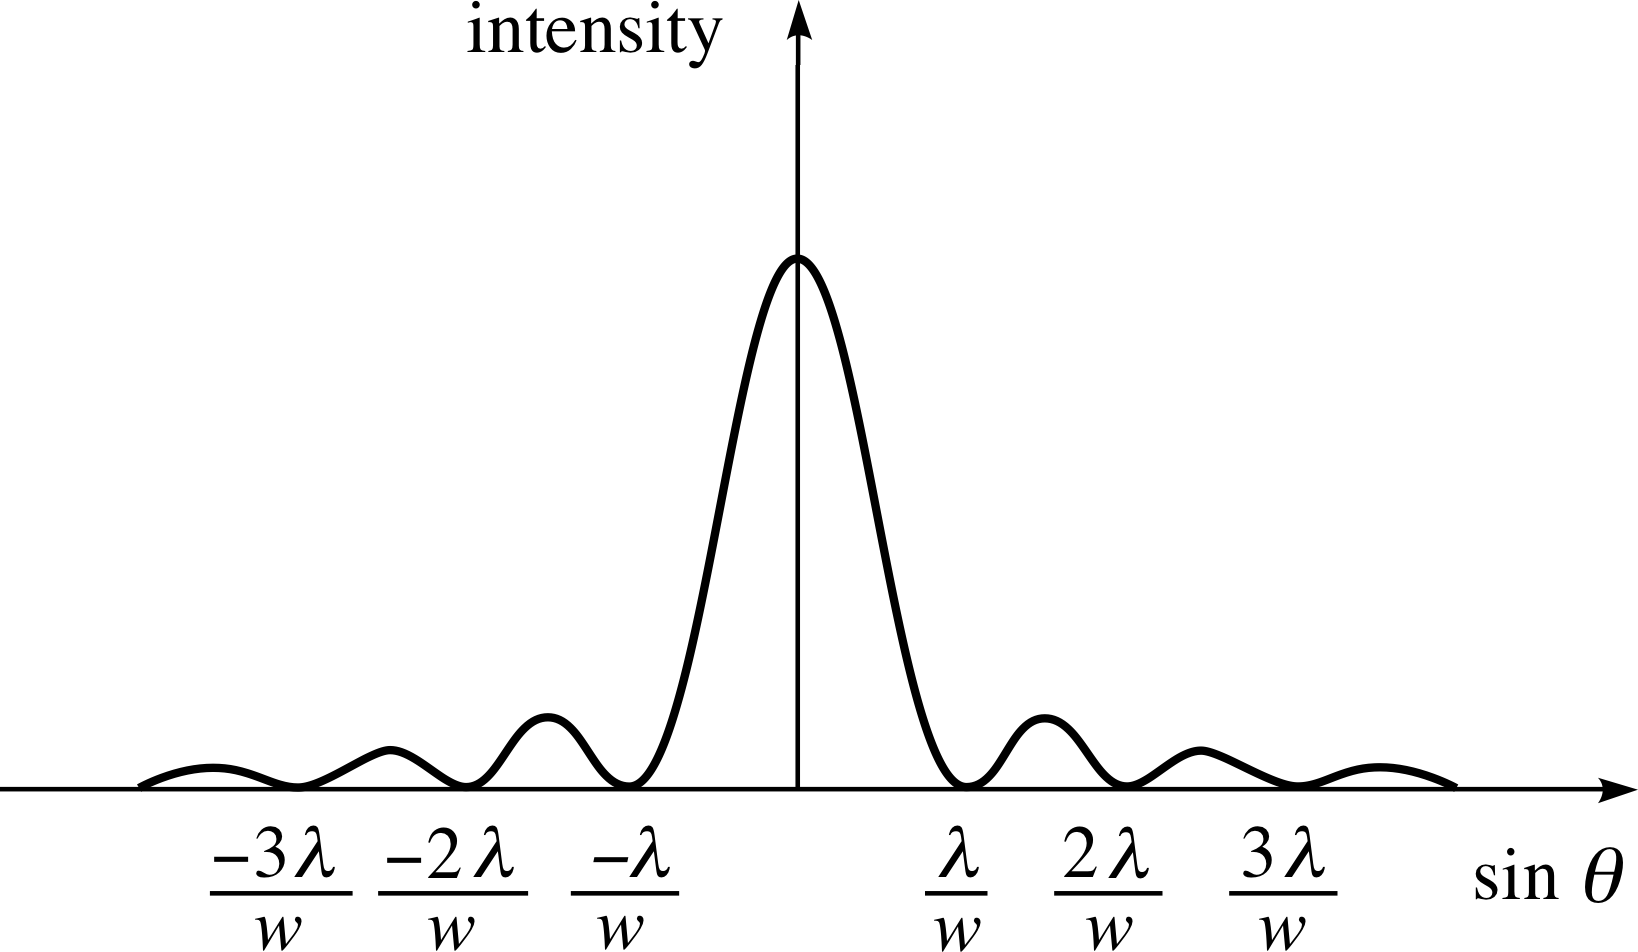
Figure 17 The observed intensity distribution on the screen for Fraunhofer diffraction at a slit.
Figure 17 shows the intensity on the distant screen for the Fraunhofer diffraction from a slit of width w plotted against sin θ. Notice the following features of this plot:
- As expected there is a central maximum, the width of which increases as the wavelength increases or as the slit width decreases.
- There are several subsidiary maxima which are much less intense and only about half as wide as the central maximum.
- The first minimum on either side of the central maximum occurs at an angle given by sin θ = ±λ/w.
Notice that the last point is in sharp contrast with the interference pattern of a diffraction grating or a double slit, where the first maximum appears at sin θ = ±λ/d. The reason for this difference will be apparent from the analysis that follows.
Our aim now is to calculate the positions of all the minima in this diffraction pattern, using secondary wavelets from all points along the slit. The task of locating the subsidiary maxima is beyond the scope of this module, except that it is clear they are about mid–way between the adjacent minima.
First, referring to Figure 16, consider wavelets from point A at the top edge of the slit and from point B in the centre. Following our treatment of Young’s two–slit experiment, the path difference from these two points to point P on the screen is (w/2) sin θ. Consequently, there will be (first order) fully destructive interference between these wavelets at P if
$\dfrac w2 \sin\theta = \lambda\quad\text{i.e. when}\quad\sin\theta = \dfrac{\lambda}{w}$
Now, this is exactly the location of the first minimum in the Fraunhofer diffraction pattern, but so far we have considered only the wavelets coming from two of the many points within the slit. Is there any reason to suppose that a location of fully destructive interference for these two contributions might also be a location of fully destructive interference for all the contributions from within the slit? Indeed there is; the symmetry of the situation tells us that destructive interference must also take place at P for wavelets from any pair of points such as A′ and B′ that are separated by w/2, and we can uniformly fill the entire slit with such pairs. Thus, every wavelet from within the slit that arrives at P interferes destructively with a wavelet from another part of the slit, and we can conclude that the amplitude at P is zero and hence the intensity there is also zero. This accounts for the first minimum in the Fraunhofer diffraction pattern.
We can also divide the aperture into quarters rather than halves and perform the same analysis with pairs of points a distance w/4 apart. In this case the values of sin θ at which fully destructive interference takes place are given by:
$\dfrac w4 \sin\theta = \dfrac{\lambda}{2}\quad\text{i.e. when}\quad\sin\theta = \dfrac{2\lambda}{w}$
Dividing further into eighths, sixteenths, etc. gives the general expression for intensity minima in Fraunhofer diffraction:
$\sin\theta_n = \dfrac{n\lambda}{w}$ with n = 1, 2, 3, ...(16)
The straight–through position, θ = 0, is always a maximum in intensity because constructive interference takes place between wavelets from pairs of points placed symmetrically about the centre of the slit (e.g. A′ and B′). Equation 16 tells us that the minima in the diffraction pattern are equally spaced with sin θ in units of λ/w from the central maxima, as is shown in Figure 17. A more complicated calculation confirms that the subsidiary maxima are much less intense than the central maximum.
Question T14
If the angle θ is small, show that the positions of the Fraunhofer diffraction minima, on a screen placed a distance D from the aperture, are given by
${\rm OP} = \dfrac{n\lambda D}{w}$
Figure 16 Fraunhofer diffraction at a single slit.
Answer T14
Refer to Figure 16 and Equation 16,
$\sin\theta_n = \dfrac{n\lambda}{w}$ with n = 1, 2, 3, ...(Eqn 16)
The angle θ is small so that sin θ ≈ tan θ. If P is a point where there is 3 minimum intensity then sin θ = nλ/w. But tan θ = OP/D so OP/D = nλ/w.
Rearranging this gives OP = nλD/w.
Figure 15 The intensity distribution from a diffraction grating with a slit separation of about four times the width of the slits.
Finally we can return to the diffraction grating and to Figure 15 to explain why the intensity of the principal maxima decrease with order as they do.
Diffraction effects from finite slit widths are important in a diffraction grating because the slits have width, w, although this must be smaller than the slit separation d. Each slit produces an identical diffraction pattern, of the form shown in Figure 17, which must be wider than the separation of the interference peaks because w < d. The net effect is that the common single slit diffraction pattern forms an overall envelope of intensity for the interference pattern.
This is shown as the dashed curve in Figure 15. The first diffraction minimum shown in Figure 15 lies just beyond the fourth order interference maximum, confirming that d ≈ 4w in our example. The dashed curve in Figure 15 begins to rise again after n = ±4, since a single–slit diffraction pattern has smaller subsidiary maxima beyond the first minima on each side.
6 Closing items
6.1 Module summary
- 1
-
Transverse electromagnetic waves, in which mutually perpendicular electric and magnetic fields oscillate at right angles to the direction of propagation, are able to account for many of the observed features of light. In a vacuum such waves travel at speed of lightthe speed of light (c = 3.00 × 10⁸ m s−1) and are characterized by their amplitude and their wavelength λ or frequency f, where c = f λ. The wavelengths corresponding to light are just a small part of the full electromagnetic spectrum.
- 2
-
An electromagnetic wave that has a unique direction associated with its electric field is said to be linearly polarized. For such a wave the plane of polarization is the plane that contains the direction of the electric field vector and the direction of propagation.
- 3
-
In a transparent material the speed and wavelength of light are smaller than they are in a vacuum by a factor called the refractive index, μ:
$\mu = \dfrac{\text{speed of light in a vacuum}}{\text{speed of light in the material}}$(Eqn 1)
- 4
-
Figure 3Huygens’ construction predicts the behaviour of propagating wavefronts by treating each point on the wavefront as a source of secondary wavelets in accordance with Huygens’ principle.
- 5
-
Diffraction is the spreading of a propagating wavefront away from its original direction of propagation that occurs whenever the wavefront encounters an aperture or an obstacle. It is an observed property of light and its effects are especially significant when they are caused by an object whose size is comparable with the wavelength of light. When diffraction effects are insignificant the advance of the wavefront can be represented by a ray.
- 6
-
The wave model of light can also explain the law of reflection (θi = θR) and
the law of refractionlaw of refraction (Snell’s law) $\dfrac{\sin\theta_{\rm i}}{\sin\theta_{\rm r}}= \dfrac{\mu_2}{\mu_1}$(Eqn 4)
- 7
-
The intensity of a uniform beam of light is the power transferred per unit area perpendicular to the beam. The intensity of a uniform plane electromagnetic wave is proportional to the square of its electric field amplitude. The intensity of light from a uniformly radiating point source decreases as the inverse square of the distance from the source.
- 8
-
According to the superposition principle if two or more waves meet in a region of space, then at each instant of time the net disturbance they cause at any point is given by the sum of the disturbances caused by each of the waves individually.
- 9
-
Light from a coherent source can interfere constructively or destructively. This is demonstrated by the pattern of interference fringes seen in Young’s two–slit experiment. With slits separated by distance d and monochromatic light of wavelength λ, the directions of maximum intensity at order n are given by:
$sin\theta_n = \dfrac{n\lambda}{d}$(Eqn 15)
- 10
-
Interference is responsible for the colours seen in reflection from thin transparent films such as soap or oil films. It also has many practical applications, such as its use in low–reflectivity coatings for lenses and high–reflectivity coatings for mirrors.
- 11
-
The interference of monochromatic light from a diffraction grating results in sharply defined intensity maxima at angles that are again given by Equation 15. Diffraction gratings are important in the measurement of wavelength.
- 12
-
The Fraunhofer diffraction pattern from a single slit of width w consists of a central intensity maximum, with several minima on either side at angles given by
$sin\theta_n = \dfrac{n\lambda}{w}$(Eqn 16)
6.2 Achievements
When you have completed this module, you should be able to:
- A1
-
Define the terms that are emboldened and flagged in the margins of the module.
- A2
-
Draw a sketch indicating the instantaneous electric and magnetic fields in a linearly polarized plane wave and discuss the way in which the properties of such waves relate to properties of light such as speed of propagation, colour and intensity.
- A3
-
State Huygens’ principle (in your own words), relate it to the electromagnetic wave model of light, and use it to explain the propagation, diffraction and interference of light, including the laws of reflection and refraction.
- A4
-
Recall and use the laws of reflection and refraction (Snell’s law).
- A5
-
Relate the intensity of a uniform parallel light beam to the power of its source and, for a point–like source, derive, interpret and use the inverse square law of illumination.
- A6
-
Describe Young’s two–slit experiment and the pattern of interference fringes that it produces. Use the superposition principle and the wave model of light to account for the origin of the fringes and to derive formulae relating the angles of interference maxima and minima to the slit separation and the wavelength.
- A7
-
Explain the meaning of coherence and its significance in the observation of interference.
- A8
-
Describe and explain how interference can be observed in reflection from thin transparent films. Derive and use the formulae which give the conditions for constructive or destructive interference in terms of the angle of refraction, the film thickness and the wavelength (given the expression for the optical path difference).
- A9
-
Explain the physical principles of anti–reflection coatings and high–reflectivity coatings, and be able to calculate the thickness required for these, given the wavelength and the relevant refractive indices.
- A10
-
Describe and explain the principles of the diffraction grating, as used in transmission and in reflection.
- A11
-
Recall and use the diffraction grating relation between the angles of the interference maxima, the wavelength and the slit separation.
- A12
-
Describe Fraunhofer diffraction at a single slit and recall how the angles of the minima depend on the wavelength and on the slit width.
Study comment You may now wish to take the following Exit test for this module which tests these Achievements. If you prefer to study the module further before taking this test then return to the topModule contents to review some of the topics.
6.3 Exit test
Study comment Having completed this module, you should be able to answer the following questions each of which tests one or more of the Achievements.
Question E1 (A2)
An electromagnetic wave of wavelength 550 nm is travelling along the z–axis with its electric field of amplitude 0.10 V m−1 oscillating along the x–axis. What is the frequency of the wave? What is the direction of polarization? What is the amplitude and direction of the magnetic field?
Answer E1
Using c = f λ we have:
$f = \dfrac{c}{\lambda} = \rm \dfrac{3.00\times10^8\,m\,s^{-1}}{550\times10^{-9}\,m} = 5.45\times10^{14}\,Hz$
The direction of polarization is defined by the direction of the electric field, so the light is polarized in the x-direction. The electric and magnetic fields have magnitudes related by the expression c = E/B (SI unit of B is tesla, T)
$B = \dfrac Ec = \rm \dfrac{0.10\,V\,m^{-1}}{3.00\times10^8\,m\,s^{-1}} = 3.33\times10^{-10}\,V\,s\,m = 3.33\times10^{-10}\,T$
The magnetic field is perpendicular both to E and to the direction of propagation, so that B is along the y–axis.
(If you had difficulty with this question reread Subsection 2.2.)
Question E2 (A3 and A4)
Make sketches showing how Huygens’ secondary wavelets predict (a) diffraction at a slit, and (b) Snell’s law of refraction.
Figure 7 The refraction of a wavefront (reflection not shown). Note that the angles marked θi and θr are not themselves the angles of incidence and refraction, but they are equal to those angles.
Figure 4 The Huygens’ construction for diffraction at an aperture of width equal to five wavelengths.
Answer E2
(a) See Subsection 3.2, Figure 4.
(b) See Subsection 3.5, Figure 7.
Question E3 (A5)
Estimate the distance from Earth of the furthest star which is visible to the unaided eye. (Make the drastic assumptions that the power of the Sun (4 × 1026 W) is typical of all stars, that the minimum intensity detectable by the human eye is 7.1 × 10⁻¹⁰ W m 2 and that there is no absorption of energy in space!)
Answer E3
Using the given values and the inverse square law:
P = 4 × 1026 W and Imin = 7.1 × 10⁻¹⁰ W m−2
$r^2 = \dfrac{P}{4\pi l} = \rm \dfrac{4\times10^{26}\,W}{4\pi\times7.1\times10^{-10}\,W\,m^{-2}} = 4.5\times10^{34}\,m^2$
As light travels 9.46 × 10¹⁵ m in one year, it takes the light from this star about 20 years to make the journey to Earth! In fact we can see stars by eye at much greater distances.
(If you had difficulty with this question reread Section 4.)
Question E4 (A5)
The intensity of light from a small source decreases as the inverse square of the distance from the source. What does this imply about how the amplitudes of the oscillating electric and magnetic fields change with distance from the source?
Answer E4
Since the intensity, I, is proportional to E2 and I ∝ 1/r2 then E2 ∝ 1/r2. Hence E ∝1/r. The same is true for the magnetic field amplitude B.
(If you had difficulty with this question reread Subsection 4.1.)
Question E5 (A6)
Green light of wavelength 546.1 nm is used in a Young’s two–slit experiment where the slits are 1.5 mm apart.
(a) Find the angles of the first and second order interference maxima.
(b) If the screen is placed 2 m from the slits, find the distance on the screen between the second order minimum and the zero order maximum.
(c) What colour of light should be used so that its second order maximum appears at the same angle as the second order minimum for the green light?
Answer E5
(a) Using Equation 7,
d sin θ = nλ with n = 0, ±1, ±2, ±3, ...(Eqn 7)
for the interference maxima:
sin θ = nλ/d
and for:
$n = 1\quad\theta = \arcsin\left(\dfrac{546.1\times10^{-9}}{1.5\times10^{-3}}\right) = 0.021°$
$n = 2\quad\theta = \arcsin\left(\dfrac{2\times546.1\times10^{-9}}{1.5\times10^{-3}}\right) = 0.042°$
Figure 11 The path lengths from the slits to a distant screen.
(b) The angle of the second order minimum is given by Equation 8,
d sin θ = (n + 1/2)λ with n = 0, ±1, ±2, ±3, ...(Eqn 8)
with n = 1
sin θ = (3/2)λ/d so that:
$\theta = \arcsin\left(\dfrac{3\times546.1\times10{-9}}{2\times1.5\times10^{-3}}\right) = 0.031°$
The zero order maximum is at θ = 0 and in Figure 11 we can use the small angle approximation to give
OP = D tan θ = D sin θ = (2 m) sin 0.031° = 1.1 mm
(c) The second order minimum has n = 1, and the second order maximum has n = 2. We require λ such that (1 + 1/2) × 546.1 nm = 2λ. Hence λ = 409.6 nm.
(If you had difficulty with this question reread Subsection 5.2.)
Question E6 (A7)
What is meant by ‘a coherent light source’? Why does the production of interference fringes require coherence? How is coherence achieved (a) in a Young’s two–slit apparatus? (b) in thin film interference?
Answer E6
A ‘coherent light source’ is described in Subsection 5.3. Unless there is coherence there will be no sustained phase relationship between the beams and no predictable interference, either in time or space, hence there will be no observable fringes.
(a) In Young’s slits the slits act as coherent sources because they are illuminated by a single slit which is sufficiently narrow to act as a spatially coherent source and with a colour filter to provide the narrow frequency range needed for temporal coherence.
(b) A ray of light from one point in a source is split at the thin film. This single coherent beam is split into two coherent beams by reflection at the front and back surfaces of the film before recombining at the eye or on a screen. Each wavelength produces its own fringe system from each point on the source.
(If you had difficulty with this question reread Subsection 5.3 and 5.4.)
Question E7 (A8 and A9)
A film of oil of refractive index μ = 1.40 covers the surface of a pool of water (μ = 1.33) to a depth of 300 nm. Find the angles (θr) at which blue (λ = 450 nm), green (λ = 550 nm) and red (λ = 650 nm) light are reflected with maximum intensity in first order (i.e. n = 1).
Answer E7
The refractive index of the oil at 1.40 is above that for water at 1.33 and so a phase change occurs only at the air–oil boundary. Equation 11,
2μτ cos θr = (n + 1/2)λ for constructive interference(Eqn 11)
gives the condition for constructive interference. In first order (n = 1):
$\cos\theta_{\rm r} = \dfrac{3\lambda}{4\mu\tau}$
for blue:$\cos\theta_{\rm r} = \rm \dfrac{3\times450\,nm}{4\times1.40\times300\,nm} = 0.804$
andθr = 36.5°
for green:$\cos\theta_{\rm r} = \rm \dfrac{3\times550\,nm}{4\times1.40\times300\,nm} = 0.982$
andθr = 10.8°
for red:$\cos\theta_{\rm r} = \rm \dfrac{3\times650\,nm}{4\times1.40\times300\,nm} = 1.16$
and therefore no reflection is possible in this order, though there would be a reflection maximum in lowest order
(n = 0) when 2μτ cos θr = λ/2.
(If you had difficulty with this question reread Subsection 5.4.)
Question E8 (A10 and A11)
A diffraction grating has 12 000 slits ruled regularly on to a glass plate 2 cm wide. Find the angles of the first and second order interference maxima for the two yellow wavelengths λ = 589.0 nm and λ = 589.6 nm (sodium light) – remember to use four significant figures throughout your calculation.
Answer E8
Using Equation 15,
$\sin\theta_n = \dfrac{nλ}{d}$ with n = 0, ±1, ±2, ...(Eqn 15)
the angle θn of the nth order maximum is given by sin θn = nλ/d. The grating spacing d is calculated from the grating width and the total number of slits: d = 2 × 10⁻² m/12 000 = 1.667 × 10⁻⁶ m. So for:
$n = 1\quad\rm\lambda = 589.0\,nm\quad\theta = \arcsin\left(\dfrac{589.0\times10^{-9}}{1.667\times10^{-6}}\right) = 20.70°$
$n = 1\quad\rm\lambda = 589.6\,nm\quad\theta = \arcsin\left(\dfrac{589.6\times10^{-9}}{1.667\times10^{-6}}\right) = 20.72°$
$n = 2\quad\rm\lambda = 589.0\,nm\quad\theta = \arcsin\left(2\times\dfrac{589.0\times10^{-9}}{1.667\times10^{-6}}\right) = 44.98°$
$n = 2\quad\rm\lambda = 589.6\,nm\quad\theta = \arcsin\left(2\times\dfrac{589.6\times10^{-9}}{1.667\times10^{-6}}\right) = 45.03°$
(If you had difficulty with this question reread Subsection 5.5.)
Question E9 (A12)
An aperture of width w is illuminated by plane waves of wavelength 589.0 nm. Find the three values of w such that the first diffraction minima appear at 20°, 40° and 60°, respectively. At each of the three calculated values of w find the angles of the first diffraction minimum for green light of wavelength 546.1 nm.
Answer E9
Using Equation 16,
$\sin\theta_n = \dfrac{n\lambda}{w}$ with n = 1, 2, 3, ...(Eqn 16)
sin θ = nλ/w. Rearranging this gives: w = nλ/sin θ. For the first diffraction minimum n = 1, and we use λ = 589.0 nm to find:
$\theta = 20°\quad w = \rm \dfrac{589.0\times10^{-9}\,m}{\sin20°} = 1.72\times10^{-6}\,m = 1.72\,\mu m$
$\theta = 40°\quad w = \rm \dfrac{589.0\times10^{-9}\,m}{\sin40°} = 0.96\times10^{-6}\,m = 0.916\,\mu m$
$\theta = 60°\quad w = \rm \dfrac{589.0\times10^{-9}\,m}{\sin60°} = 0.68\times10^{-6}\,m = 0.680\,\mu m$
Notice that the diffraction angle increases as the aperture decreases.
Rearranging Equation 16 again gives θ = arcsin(nλ/w). Now λ = 546.1 nm and we have for the three slits:
$w = \rm 1.72\,\mu m\;\,\quad\theta = \arcsin\left(\dfrac{546.1\times10^{-9}}{1.72\times10^{-6}}\right) = 18.5°$
$w = \rm 0.916\,\mu m\quad\theta = \arcsin\left(\dfrac{546.1\times10^{-9}}{0.916\times10^{-6}}\right) = 36.6°$
$w = \rm 0.680\,\mu m\quad\theta = \arcsin\left(\dfrac{546.1\times10^{-9}}{0.680\times10^{-6}}\right) = 53.4°$
Notice that the diffraction angle decreases as the wavelength decreases for any slit width.
(If you had difficulty with this question reread Subsection 5.6).
Study comment This is the final Exit test question. When you have completed the Exit test go back and try the Subsection 1.2Fast track questions if you have not already done so.
If you have completed both the Fast track questions and the Exit test, then you have finished the module and may leave it here.
Study comment Having seen the Fast track questions you may feel that it would be wiser to follow the normal route through the module and to proceed directly to the following Ready to study? Subsection.
Alternatively, you may still be sufficiently comfortable with the material covered by the module to proceed directly to the Section 6Closing items.